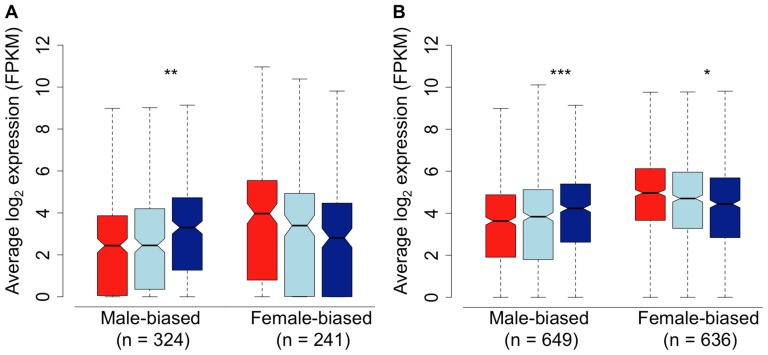
Figure 3. Sex-bias in the spleen of females (red), subordinate males (light blue) and dominant males (dark blue).
Sex-bias was defined in panel A based on a 1.5-fold change threshold between females and dominant males, with a p-value<0.05. Sex-bias in panel B is defined solely on statistical difference (p<0.05) between females and dominant males. Significant difference between dominant and subordinate males is indicated (Wilcoxon test, * p<0.05, ** p<0.01, *** p<0.001, **** p<0.0001).

