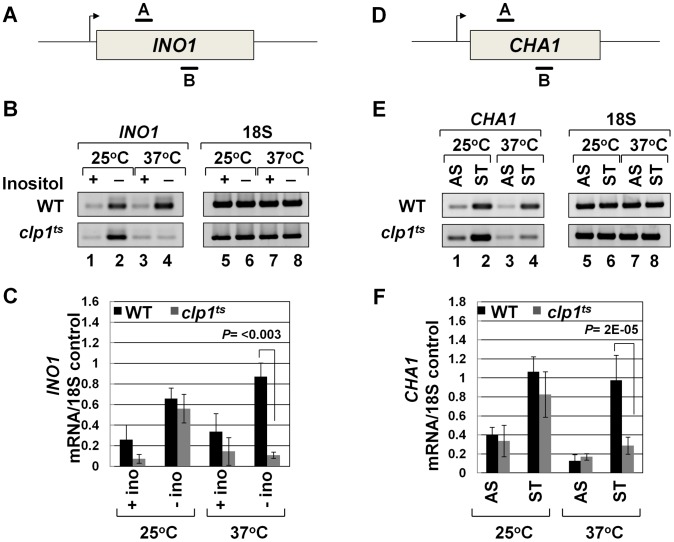
Figure 1. Transcript levels of INO1 and CHA1 are adversely affected in the clp1ts mutant.
(A, D) Schematic representations of INO1 and CHA1 showing the positions of the primer pairs used in RT-PCR analysis. (B) and (E) RT-PCR analysis of INO1 and CHA1 in clp1ts and isogenic wild type strains during induced and non-induced transcription at 25°C and 37°C. (C) and (F) Quantification of the data shown in B and E respectively. The transcript level of 18S was used as the control. The results shown are an average of four PCRs from two cDNA preparations from two different RNA extractions. Error bars indicate one unit of standard deviation. AS = Ammonium sulfate, ST = Serine/Threonine, WT = Wild type.

