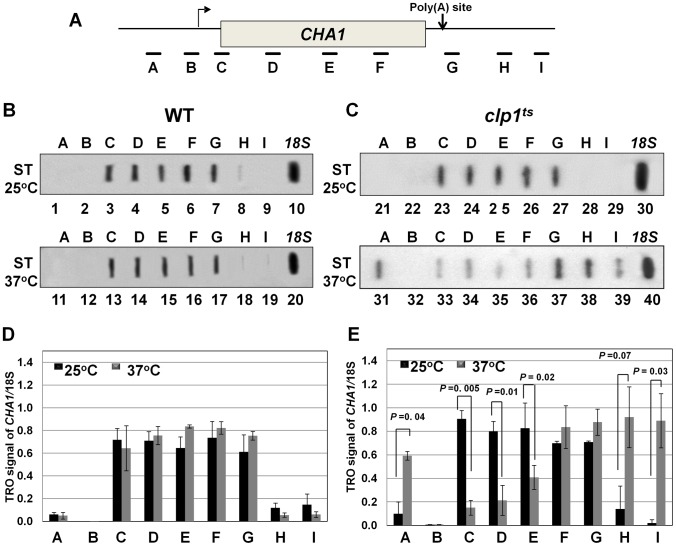
Figure 2. TRO analysis showing transcription readthrough and alteration in promoter-associated transcription in the clp1ts mutant.
(A) Schematic depiction of the CHA1 gene indicating the positions of the probes (A–I) used in the TRO assay. (B) TRO analysis of CHA1 in the wild type strain at 25°C and 37°C under induced transcription of the gene. (C) TRO analysis of CHA1 in the temperature-sensitive mutant of Clp1 at the permissive (25°C) and non-permissive (37°C) temperatures. (D) and (E) Quantification of the data shown in B and C respectively. Error bars indicate one unit of standard deviation. The results shown are an average of at least four independent replicates. ST = Serine/Threonine, WT = Wild type, TRO = Transcription run-on.

