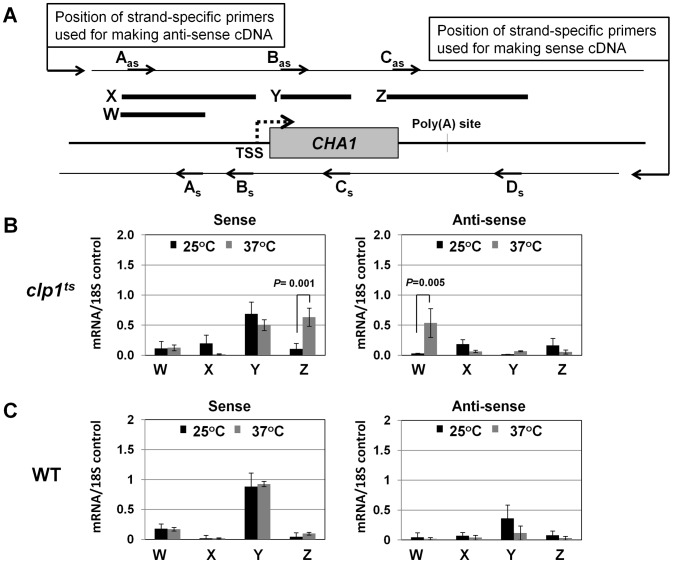
Figure 3. Strand specific RT-PCR showing transcription readthrough and promoter-initiated anti-sense transcription in the clp1ts mutant.
(A) Schematic representation of the CHA1 locus indicating the positions of primers used for reverse-transcribing sense transcripts (As, Bs, Cs and Ds) and anti-sense transcripts (Aas, Bas and Cas), and W, X, Y and Z regions amplified in RT-PCR analysis. (B) Strand-specific RT-PCR analysis of sense and anti-sense transcripts of CHA1 in the clp1 mutant at the permissive (25°C, black bars) and non-permissive (37°C, grey bars) temperatures. (C) Strand-specific RT-PCR analysis of sense and anti-sense transcripts of CHA1 in the isogenic wild type strain at 25°C (black bars) and 37°C (grey bars). The results shown are an average of four PCRs from two cDNA preparations from two different RNA extractions. Error bars indicate one unit of standard deviation. TSS = Transcription start site, WT = Wild type, subscript s = sense and as = antisense.

