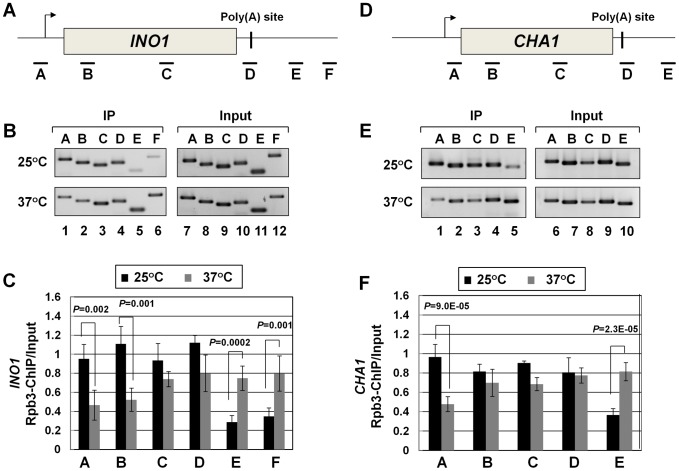
Figure 4. RNAP II density in the promoter region exhibits a decline in the clp1ts mutant.
(A, D) Schematic depictions of INO1 and CHA1 showing the positions of ChIP primer pairs. (B, E) ChIP analysis showing polymerase density in different regions of INO1 and CHA1 in the clp1 mutant at the permissive (25°C) and non-permissive (37°C) temperatures. (C and F) Quantification of data shown in B and E respectively. The input signals represent DNA prior to immunoprecipitation. The results shown are an average of at least eight independent PCRs from four separate immunoprecipitates from two independently grown cultures. Error bars indicate one unit of standard deviation. IP = immunoprecipitate.

