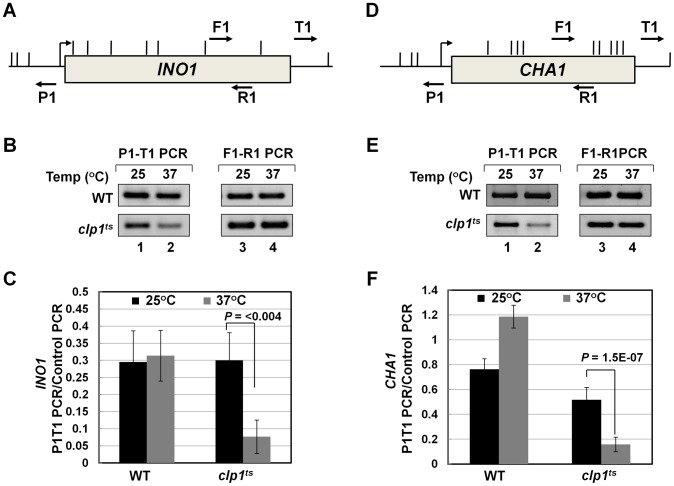
Figure 6. Gene looping of INO1 and CHA1 is compromised in clp1ts mutant.
(A) and (D) Schematic depictions of INO1 and CHA1 indicating the position of restriction sites (vertical lines) and PCR primers (arrows) used in 3C analysis. (B) and (E) 3C analysis of INO1 and CHA1 to detect gene looping in the clp1ts mutant and the isogenic wild type strains at either permissive (25°C) or nonpermissive (37°C) temperatures. P1-T1 PCR reflects the looping signal while F1-R1 PCR represents the loading control indicating that an equal amount of template DNA was present in each of the 3C reactions. (C) and (F) Quantification of the 3C results shown in B and E. The results shown are an average of at least eight independent PCRs from four separate 3C replicates from two independently grown cultures. Error bars indicate one unit of standard deviation. WT = Wild type.

