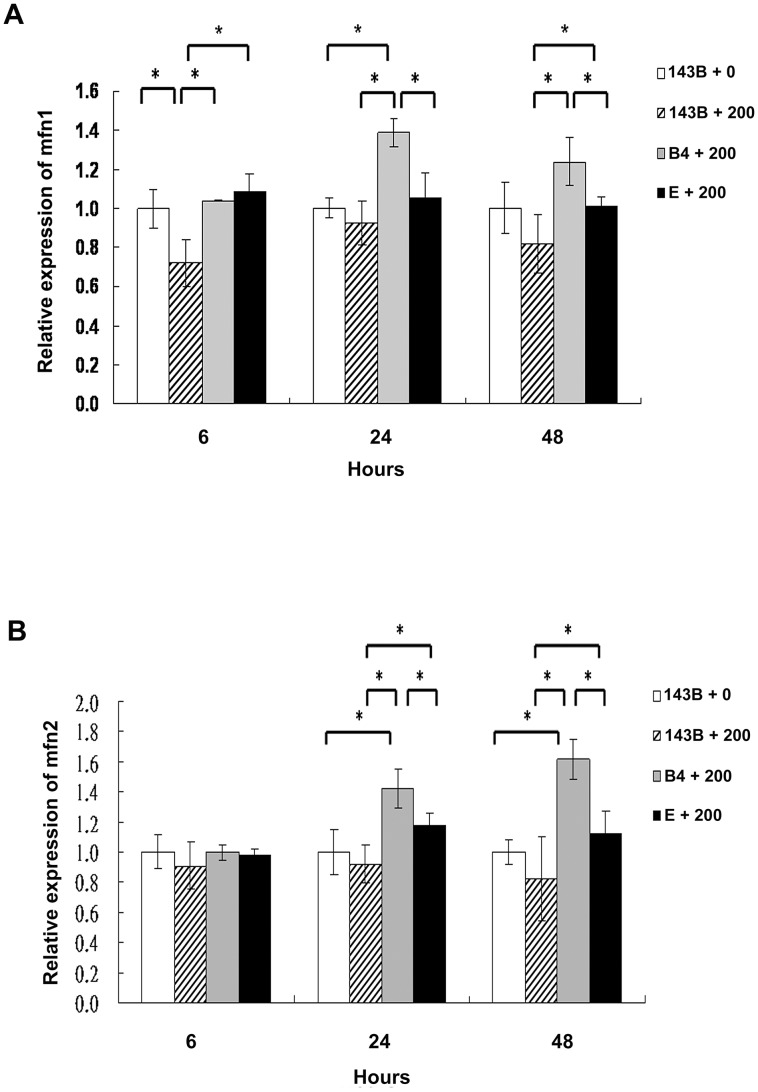
Figure 4. Analysis of the mitochondrial fusion molecules expression in the parental 143B cells, and cybrid B4 and E cells after the bile acid treatment.
Western blot analysis of mitofusin 1 (mfn1) and mitofusin 2 (mfn2) expression in parental 143B cells, B4 and E cybrids after treatment with bile acid. (A) Histogram showed statistical difference between groups in mfn1 expression. Western blot of mfn 1 expression in parental 143B cells, B4 and E cybrids after treatment with 200 uM bile acid for 24 h and 48 h. (B) Histogram showed statistical difference between groups in mfn2 expression. Western blot of mfn 2 expression in parental 143B cells, B4 and E cybrids after treatment with 200 uM bile acid for 24 h and 48 h. The results represented were mean ± SE in six times tests * P<0.05.

