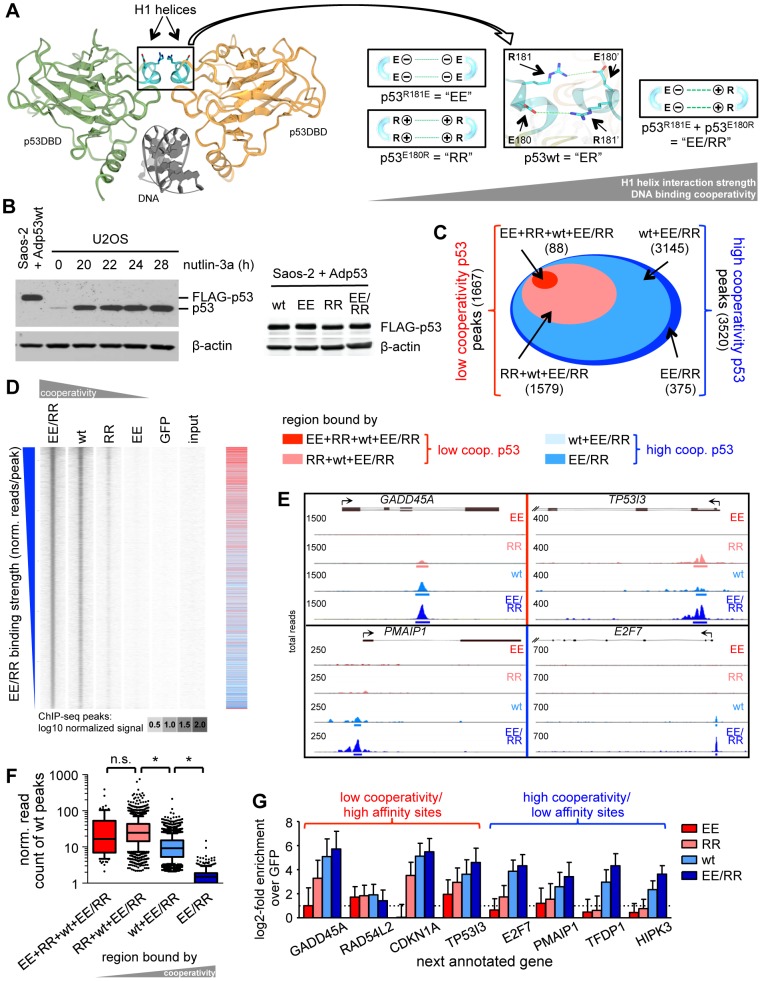
Figure 1. DNA binding cooperativity extends the p53 cistrome to low affinity binding sites.
(A) Left: dimer of p53 DNA binding domains (green and yellow) on the DNA (gray) (Protein Data Bank ID code 2ADY) [20]. Highlighted in blue are the H1 helices. Right: Design of complementing p53 cooperativity mutants at glutamate E180 or arginine R181. (B) p53 Western Blot of U2OS cells treated for the indicated time with 10 µM nutlin-3a and Saos-2 cells infected for 18 hours with the indicated p53-expressing adenoviruses. β-actin is shown as a loading control. (C) Classification of p53 binding sites identified by ChIP-seq according to cooperativity. (D) Density blot of all p53 ChIP-seq peaks arranged in order of decreasing EE/RR binding strength. The heat map (right) depicts the classification illustrated in (C). (E) Strength of wild-type p53 binding to low and high cooperativity regions. Depicted is a box-and-whiskers blot with 10/90 percentiles and the median; outliers are plotted as dots. n.s.; not significant. *; p-value<0.001 (ANOVA-Tukeys honest significant differences based on log-transformed normalized read counts). (F) Genome browser views of p53 binding to selected low (top) and high (bottom) cooperativity regions. The numbers on the y-axis of each track represent the total number of overlapping reads. (G) Validation of ChIP-seq data by qPCR. Shown is the mean (±SD) log2-fold enrichment relative to the GFP control sample of two independent experiments with three qPCR replicates each.

