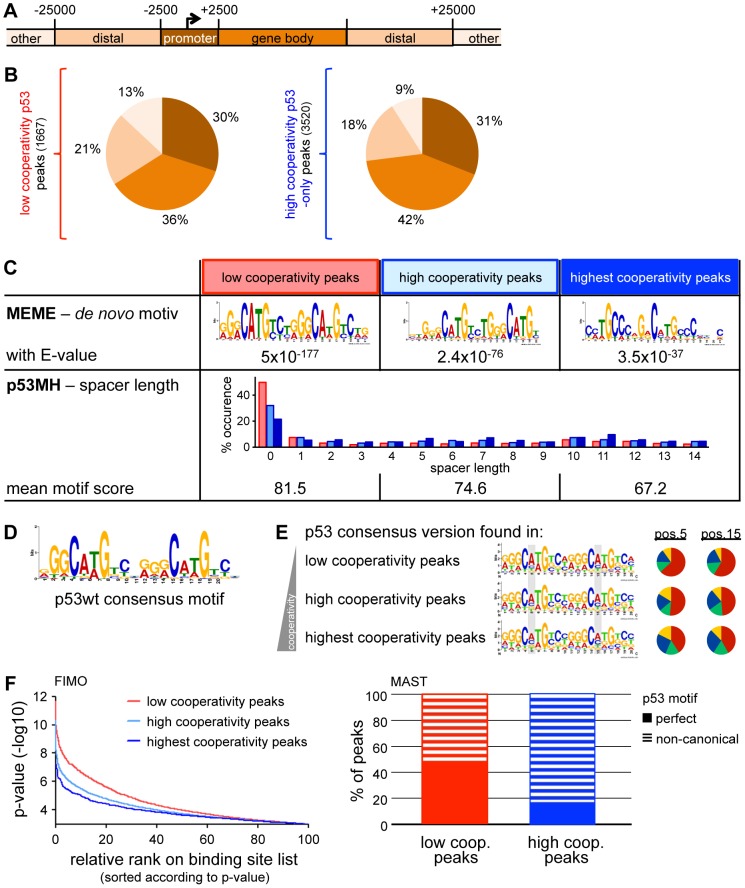
Figure 2. Cooperativity reduces the sequence specificity of p53 DNA binding.
(A) Classification of genomic regions. (B) Distribution of p53 binding sites across the genome on the basis of the classification depicted in (A). (C) Motif analysis within low (first column), high (second column) and highest cooperativity p53 binding sites. The third column represents the subgroup of high cooperativity binding sites bound by EE/RR only. Top: De novo motif search by MEME-ChIP. Depicted is the top motif (lowest E-value). Bottom: Distribution of spacer lengths and mean motif score determined by the p53MH algorithm. (D) The p53 consensus motif generated from the top50 wild-type p53 binding sites in this study. (E) Low cooperativity mutants display a preference for CAWG at the CWWG core of the p53 consensus binding sequence. Motifs fitting to the p53 consensus sequence (D) within the three different cooperativity groups of binding sites defined in (C) were identified using FIMO and illustrated by WebLogo. The pie charts represent the base distribution at positions 5 and 15 of the consensus sequence (shaded in gray). (F) Low cooperativity sites confine better to the p53 consensus binding sequence than high cooperativity sites. Left: p53 binding sites in the indicated cooperativity groups were ranked according to similarity (p-value) to the p53 consensus binding sequence as determined with the FIMO algorithm. Right: Percentage of peaks containing perfect or non-canonical p53 motifs in low and high cooperativity regions, respectively, based on MAST analysis.

