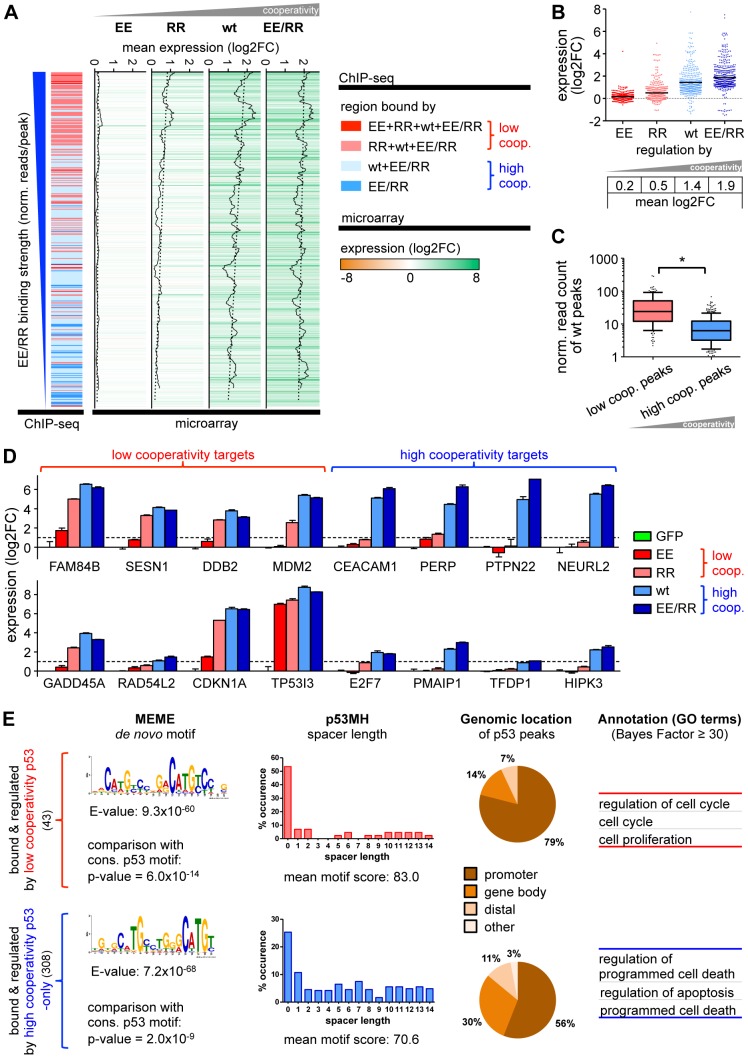
Figure 5. Gene regulation by p53 is cooperativity-dependent.
(A) Correlation of the ChIP-seq data with the corresponding expression profiles revealed 351 differentially expressed genes with 489 distinct binding sites. Expression levels of these genes are depicted in a heat map ranked by decreasing EE/RR binding strength. The cooperativity classification of genes according to ChIP-seq is shown on the left as in Fig. 1D. Gene regulation by p53 increases with DNA binding cooperativity and correlates with DNA binding strength as shown in the walking average plot of expression for each p53 cooperativity mutant. (B) Expression of p53-bound and -regulated genes according to cooperativity. Shown is the log2-fold expression change. The black horizontal bar indicates the mean. (C) DNA binding strength (in reads/peak) of wild-type p53 to low or high cooperativity sites in differentially regulated genes. Depicted is a box-and-whiskers blot with 10/90 percentiles and the median; outliers are plotted as dots. *, p<0.001. (D) Validation of microarray results by RTqPCR analysis. Shown is the mean (±SD, n = 3) log2-fold expression change. (E) Motif search (MEME), spacer analysis (p53MH) and genomic classification of p53 binding sites in differentially regulated genes followed by functional annotation with GO terms as in Fig. 2 and 3.

