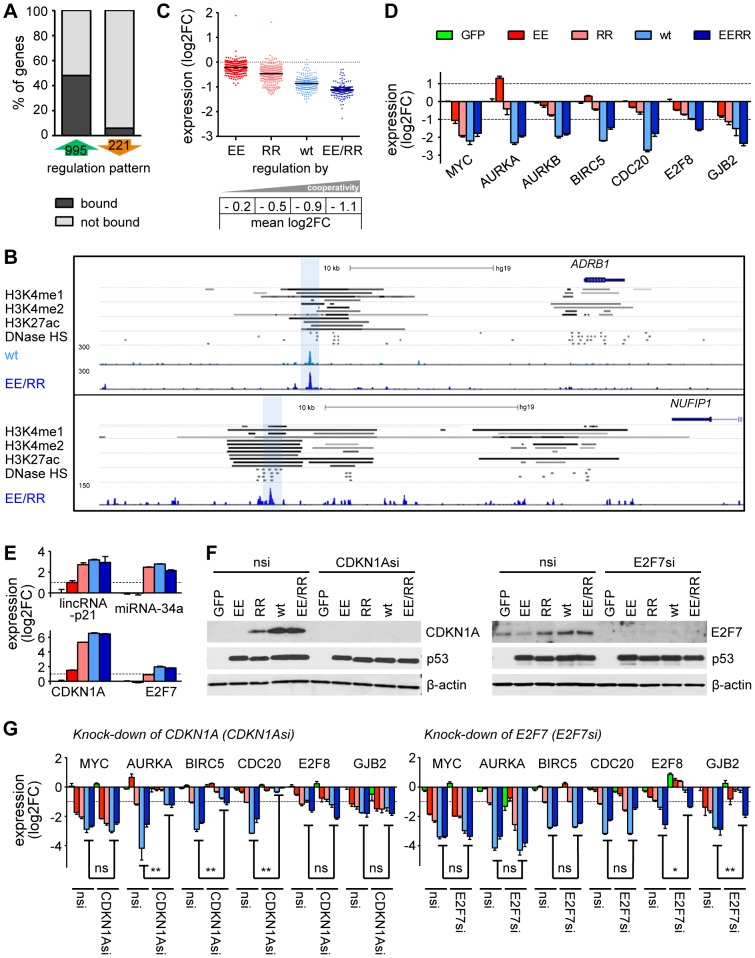
Figure 7. p53-dependent gene repression requires high DNA binding cooperativity.
(A) The percentage of differentially regulated genes with or without a p53 binding site in our ChIP-seq dataset. (B) Genome browser views of distal p53 binding peaks that overlap with enhancer sites marked by H3K4 mono- and dimethylation, H3K27 acetylation and DNase I hypersensitivity (HS) in four different cell lines (GM12878, HUVEC, NHEK, HSMM; named in the order of appearance). The bars represent regions of statistically significant signal enrichment [UCSC browser tracks; 71]. (C) Expression of p53-downregulated genes according to cooperativity. The black horizontal bar indicates the mean. (D) Validation of the microarray results by RTqPCR analysis. (E) Expression analysis of indicated genes by RTqPCR analysis. (E–G) CDKN1A and E2F7 are transactivated in a cooperativity-dependent manner (RTqPCR, E; immunoblot, F) and mediate p53-dependent repression of target genes (RTqPCR, G). nsi, non-silencing control siRNA. All bar graphs in this figure show the mean (±SD, n = 3) log2-fold expression change. Two-tailed Mann-Whitney U test: *, p<0.05; **, p<0.01. Bar colors are as indicated in (D).

