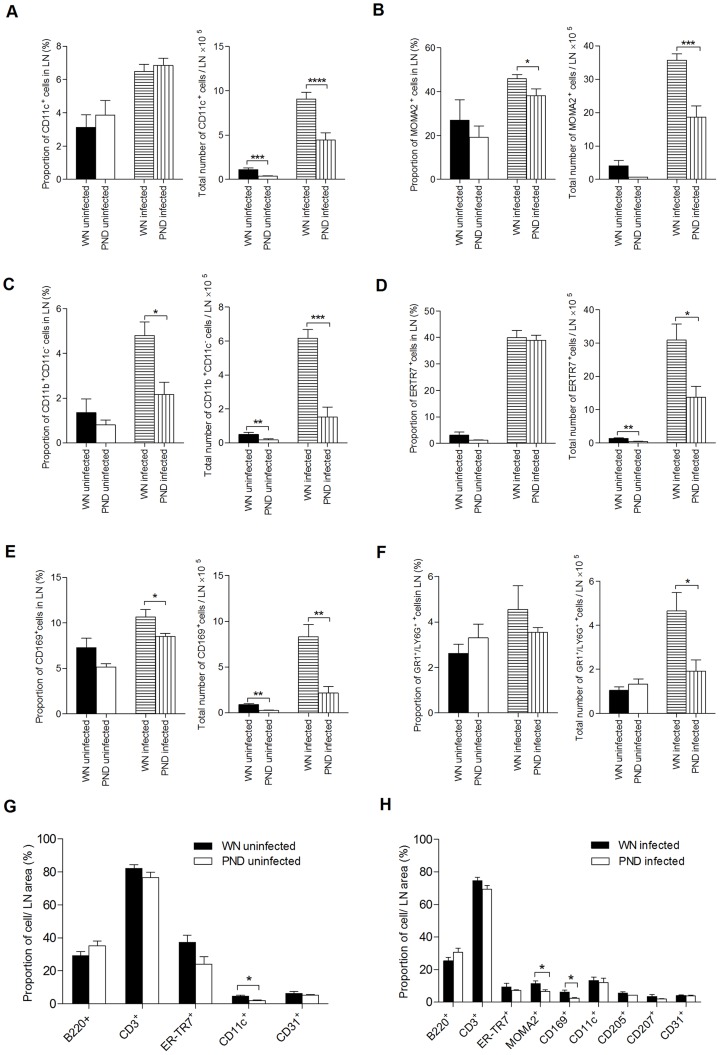
Figure 4. Malnutrition reduces lymph node cellularity in uninfected and L. donovani infected mice.
Flow cytometry was used to determine the percentage (A–F, left panels) and total number (A–F, right panels) of LN cell populations in well-nourished (WN) and polynutrient deficient (PND) mice uninfected or infected with L. donovani for 3 days using markers for (A) DCs (CD11c), (B and C) macrophages (MOMA2 and CD11b+/CD11c−, respectively), (D) FRC (ER-TR7), (E) subcapsular sinus macrophages (CD169), and (F) neutrophils (GR1/LY6G). The different lymph node cell populations described above, as well as B cells (B220), T cells (CD3) and endothelial cells (CD31), were also quantified by immunofluorescence staining of frozen sections relative to the area of lymph node of WN and PND uninfected (G), and L. donovani infected mice (H). The data shown for each individual cell population in the WN and PND mice are the mean and SEM (error bars) from same experiment (n = 6 per group), which was representative of at least two independent experiments. As such, the figure includes data derived from multiple experiments since the small size of the LN in the malnourished mice precluded the quantification of multiple populations within the same LN. (*, p<0.05; **, p<0.01; ***, p<0.001; ****, p<0.0001).

