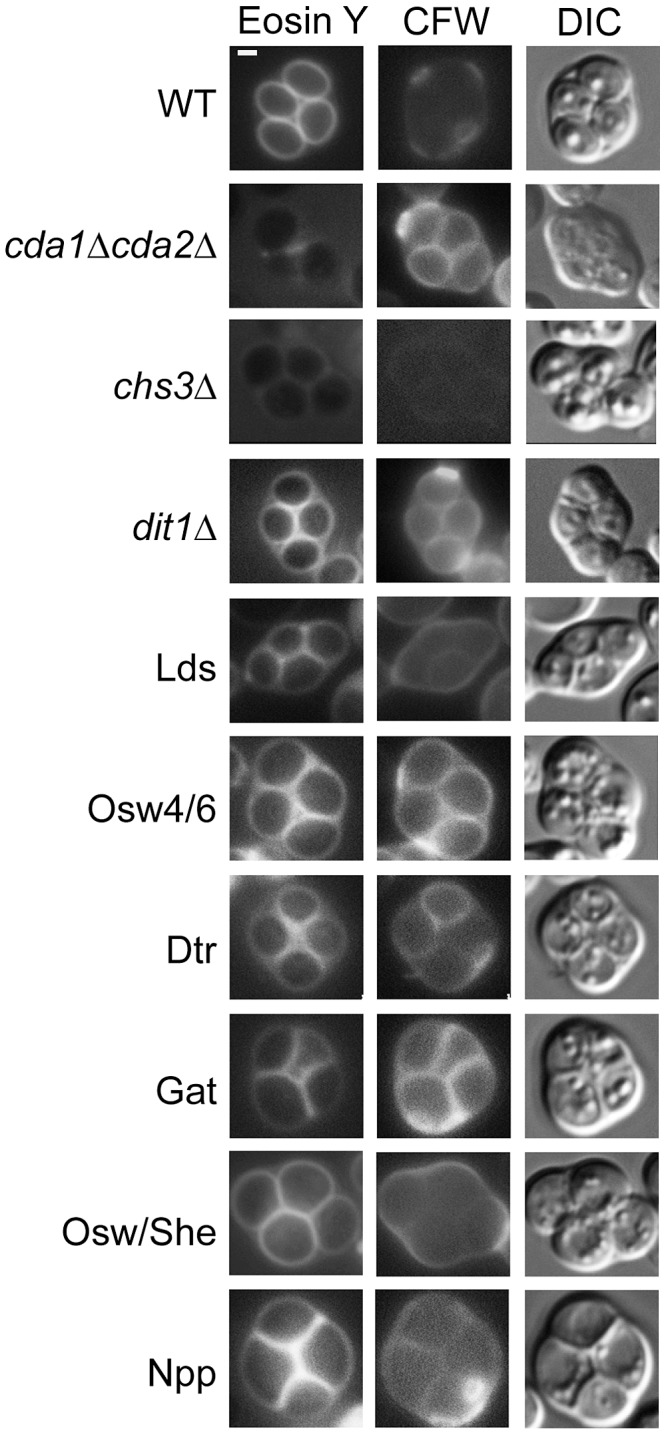
Figure 4. The effect of deletion of paralog sets on chitosan.

Strains of the indicated genotype were sporulated and stained with both Eosin Y and Calcofluor White (CFW) to visualize the chitosan layer. The cda1Δ cda2Δ, chs3Δ, and dit1Δ strains provide standards for the conditions chitin/no chitosan/no dityrosine, no chitin/no chitosan/no dityrosine, and chitin/chitosan/no dityrosine, respectively. For all strains >30 cells were examined and >60% display the staining patterns shown here. Quantitation for each strain is given in Table S2. DIC = differential interference contrast. Scale bar = 1 micron. Multiple mutant diploids are indicated by the name of the set of genes deleted as listed in Table 2.
