
Figure 6. Effect of Mediator disruption on euchromatic genes.
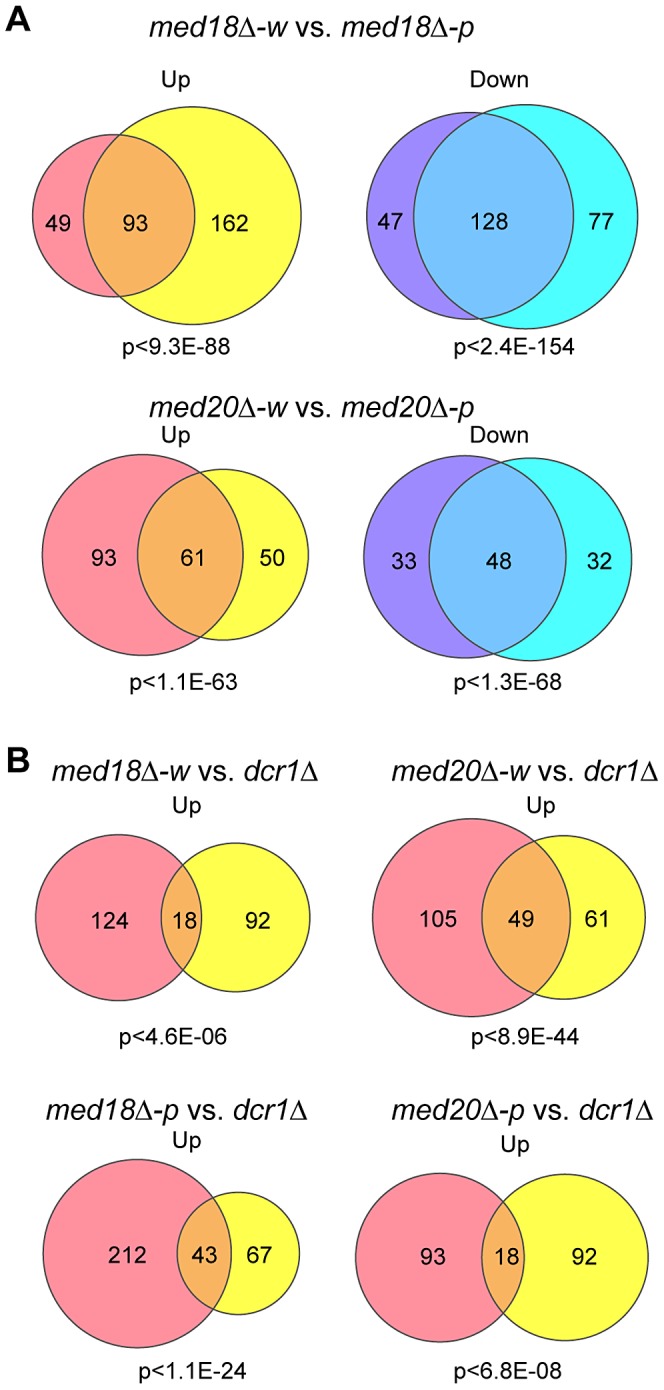
Venn diagram showing the number of transcripts whose expression levels are increased (up) or decreased (down) >1.5-fold in mutants compared to the wild-type. P-values were calculated using Fisher's exact test. (A) Transcripts of med18Δ-w (left circles) vs. med18Δ-p (right circles) mutants (top) and med20Δ-w (left circles) vs. med20Δ-p (right circles) mutants (bottom). (B) Transcripts of med18Δ-w (left circles) vs. dcr1Δ (right circles) mutants (upper left), med20Δ-w (left circles) vs. dcr1Δ (right circles) mutants (upper right), med18Δ-p (left circles) vs. dcr1Δ (right circles) mutants (lower left), and med20Δ-p (left circles) vs. dcr1Δ (right circles) mutants (lower right).