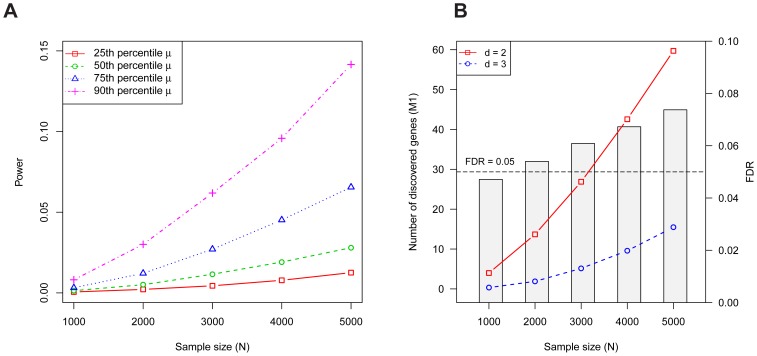
Figure 1. Properties of the Multiplicity Test.
(A) The probability a risk gene has two or more de novo LoF mutations in  families (i.e., the power) depends on the mutation rate
  . Power per gene of the Multiplicity Test as a function of
  is shown for 4 mutation rates, which were chosen based on percentiles (25'th, 50'th, 75'th, 90'th) of the distribution of
  obtained from the full gene set. (B) The expected number of risk genes discovered by the Multiplicity Test at
  (red, solid) or 3 (blue, dashed) as a function of the sample size
  . The barplot shows the FDR at
  . The simulation assumes 1000 diseases genes out of 18,000, each with relative risk
  ; these parameters were estimated in the section on Genetic Architecture of ASD.

