
Figure 4. The power per gene of competing tests.

The results of three tests are shown: novo (red), meta (blue), and TADA (purple). Results are shown for various values of  ,
,  and
and  with type I error fixed at 0.001. Parameter values are chosen to cover plausible parameter values according to our model estimation: (A)
 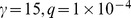 ; (B)
; (B) 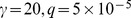 ; and (C)
 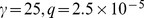 .
.