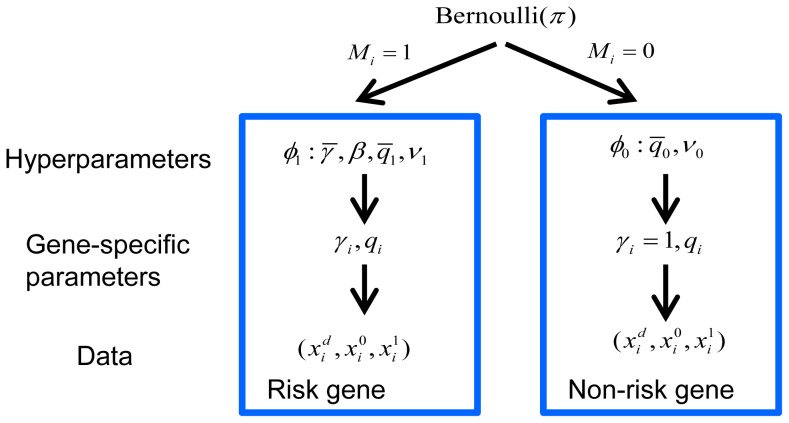
Figure 6. Bayesian hierarchical model of TADA.
A fraction  of the genes are associated with the phenotype under investigation and follow model
  , and the remainder follow model
  . The prior distribution of gene-specific parameters, relative risk (
 ) and allele frequency (
 ), can vary under the competing models,
  or
or  . Priors are specified by the hyperparameters,
  and
and  , respectively, which are estimated from the data. Counts of events for the i-th gene follow a Poisson distribution, parameterized by
  and
and  under
under  , and
, and  under
under  .
.

