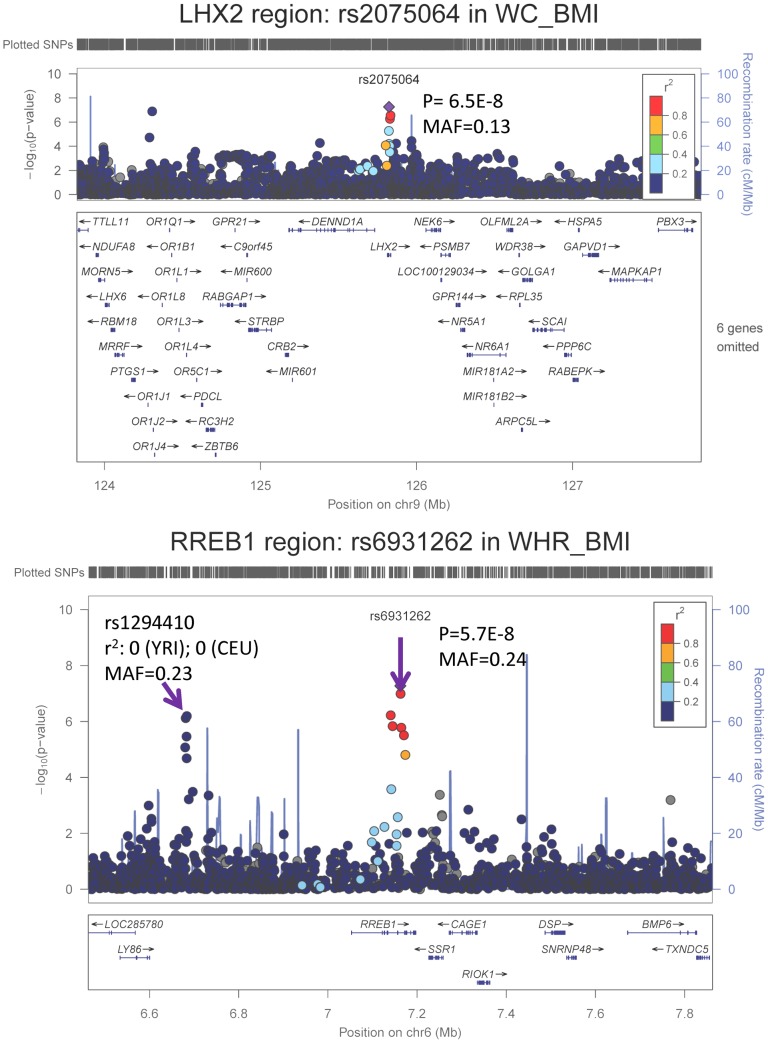
Figure 1. Regional association plots based on single GC-corrected p-value for LHX2 and RREB1, Stage 1 only.
MAF = minor allele frequency. The p-values for the index SNP rs2075064 in LHX2 loci are 5.5E-8, 0.03, and 2.2E-8 for Stage 1, Stage 2 and joint analysis. The p-values for the index SNP rs6931262 at RREB1 loci are 5.3E-8, 0.02 and 2.5E-8 for Stage 1, Stage 2 and joint analysis. The double GC-corrected p-value for the joint analysis are 6.5E-8, 5.7E-8 and 1.8E-6 for rs2075064, rs6931262 and rs1294410, respectively.

