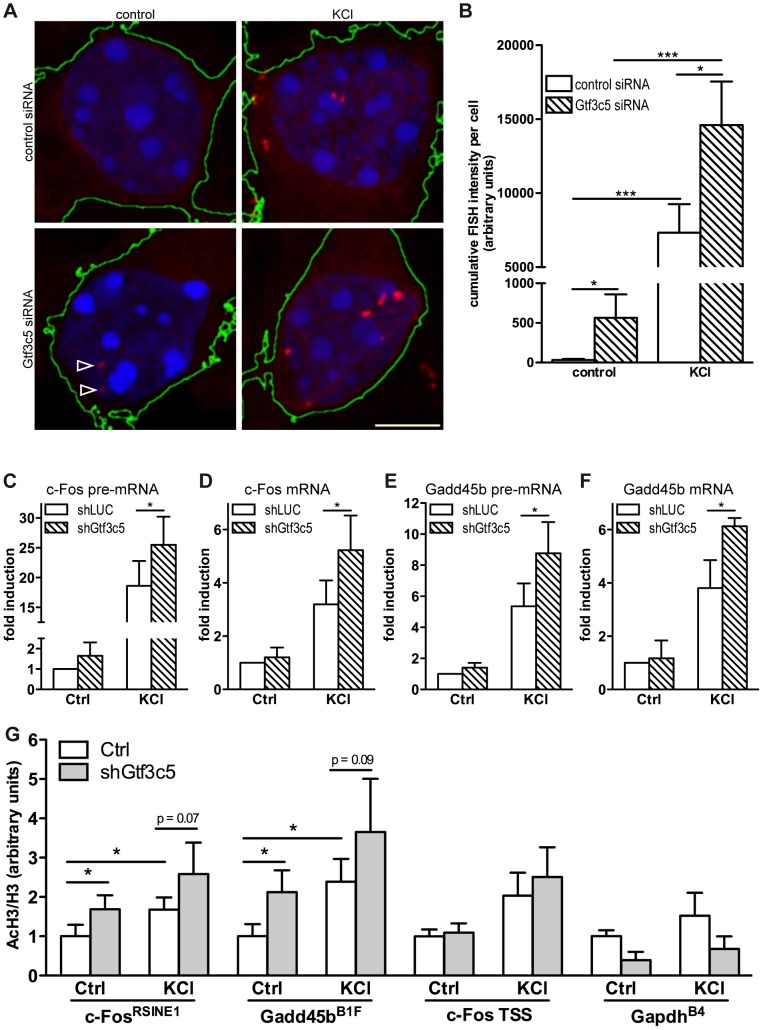
Figure 3. TFIIIC controls activity-dependent genes transcription and SINE acetylation.
(A) Representative images of cortical neurons transfected with a GFP expression vector and either control or Gtf3c5 siRNA. Neurons were transfected at DIV2, after three days exposed to 50 mM KCl for 45 minutes or left untreated, and subjected to quantitative RNA-FISH analysis of c-Fos mRNA. Maximal z-projections of confocal stacks of transfected cells are shown. In GFP-expressing cells, c-Fos mRNA ribonucleoparticles (red) were detected by FISH (reconstructed cell edges are shown in green). Nuclei were stained with DAPI (blue). Ribonucleoparticles showing low levels of c-Fos mRNA are indicated by arrowheads. (B) Quantitative analysis of RNA-FISH experiments. For each neuron, total fluorescence intensity of all c-Fos mRNA particles was calculated. Average and s.e.m. of at least 25 cells per condition are shown (*, P<0.05; **, P<0.01; ***, P<0.001, two-way ANOVA). (C, D, E and F) Mouse primary cortical neurons were infected with lentiviral particles driving the expression of a short hairpin RNA targeting either firefly luciferase (shLUC, as a negative control) or Gtf3c5 (shGtf3c5). 4 days later cells were stimulated with either 50 mM KCl for 45 minutes or left untreated, then subjected to RNA extraction and cDNA synthesis, followed by qRT-PCR analysis of c-Fos and Gadd45b pre-mRNA (C, E) and mRNA (D, F). Silencing of Gtf3c5 was sufficient to drive a significant enhancement of activity-dependent transcription, as assessed both at the level of pre-mRNA (C, E) and fully processed RNA (D, F). (G) Primary cortical neurons were infected with lentiviral particles driving the expression of a short hairpin RNA targeting either firefly luciferase (shLUC, as a negative control) or Gtf3c5 (shGtf3c5). 4 days later cells were stimulated with either 50 mM KCl for 45 minutes or left untreated, then subjected to ChIP using either H3K9K14ac or histone H3 antibodies, followed by qPCR. Lentiviral-mediated silencing of Gtf3c5 enhanced histone H3 acetylation at c-Fos RSINE1, Gadd45b B1F and not at c-Fos TSS and Gapdh B4. Histograms show the ratio of immunoprecipitation efficiency between H3K9K14ac and H3 antibodies relative to total chromatin input (average and s.e.m. of 5 experiments are shown; *, P<0.05, Student's t-test).

