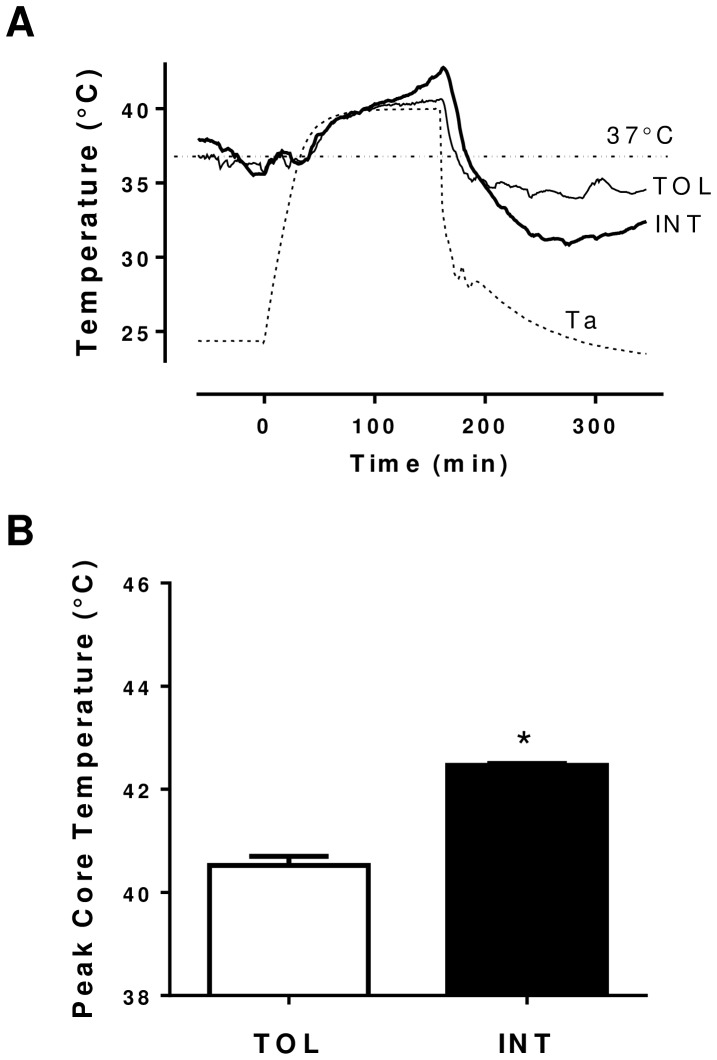
Figure 1. Temperature profiles associated with TOL and INT mice in response to heat exposure.
(A) Representative tracings of animal core temperature before, during and after heat exposure. The signals were recorded simultaneously in real-time from a single experiment. The ambient temperature (Ta) was obtained inside an environmental chamber. (B) Average peak core temperature of TOL and INT mice during heat exposure experiments. *p<0.05 for differences (mean ± SEM, n = 6) between TOL and INT mice groups.

