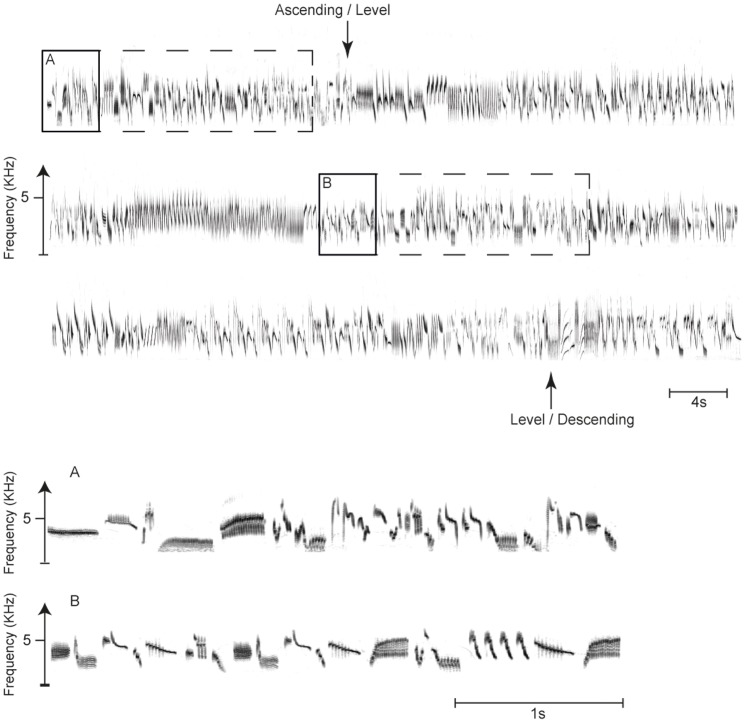
Figure 1. Sound spectrogram of a complete flight song of a male skylark (above) and of two excerpts of the same (below).
Dotted line squares highlight 20 s of song produced during the ascending and the level phases as used for acoustic analysis and playback; fine structure of the syllables produced in each phase is shown below (A and B) at higher scale for the song in the continuous line squares. The arrows indicate the transition between the song produced during the ascending, the level and the descending phase.

