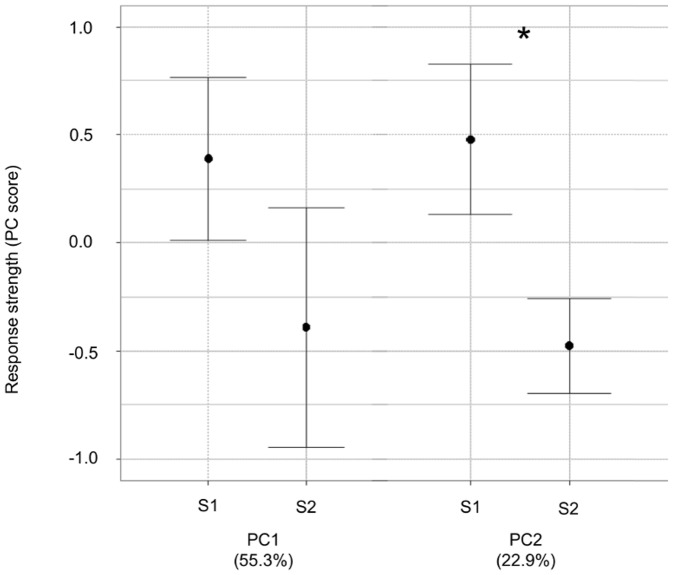
Figure 4. Skylarks respond more strongly to S2 stimuli.
Mean scores (±SE) of the first and the second principal components for responses to the two stimuli (S1: level phase of flight song from neighbour of the opposite side; S2: ascending phase of flight song from neighbour of the opposite side). * p = 0.024. Variance explained by the scores is given in parentheses. There was no effect of the order of presentation (GLM, F = 0.53 p>0.1).

