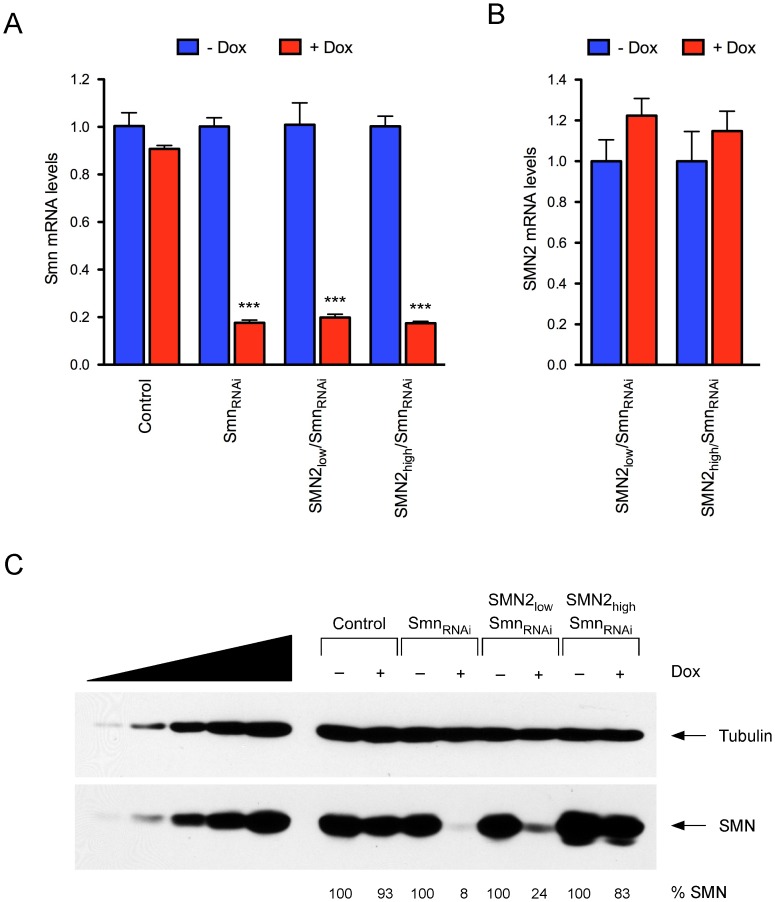
Figure 4. Inducible knockdown of endogenous mouse Smn in NIH3T3-SMN2/SmnRNAi cell lines.
(A) RT-qPCR analysis of mouse Smn mRNA levels in wild-type (Control), NIH3T3-SmnRNAi, NIH3T3-SMN2low/SmnRNAi and NIH3T3-SMN2high/SmnRNAi cell lines cultured with and without Dox for 7 days. Data in Dox-treated cells were normalized to those in untreated cells and represented as mean and SEM (n = 3; *** = p<0.001; t-test). (B) RT-qPCR analysis of human SMN2 mRNA levels in NIH3T3-SMN2low/SmnRNAi and NIH3T3-SMN2high/SmnRNAi cell lines cultured with and without Dox for 7 days. Data in Dox-treated cells were normalized to those in untreated cells and represented as mean and SEM. (C) Western blot analysis of equal amounts of proteins from wild-type (Control), NIH3T3-SmnRNAi, NIH3T3-SMN2low/SmnRNAi and NIH3T3-SMN2high/SmnRNAi cell lines cultured with and without Dox for 7 days using monoclonal antibodies against the indicated proteins. For each cell line, SMN levels in Dox-treated relative to untreated cells are shown at the bottom.

