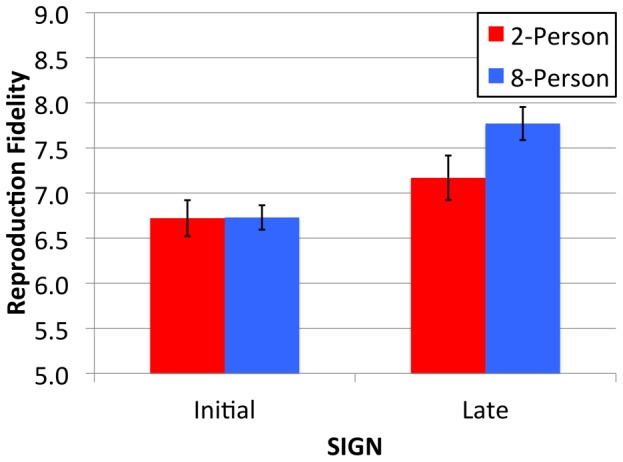
Figure 6. Mean reproduction fidelity (on a rating scale from 0–9, where 0 = very dissimilar and 9 = very similar) of Initial and Late 2-Person (red bars) and 8-Person (blue bars) signs.

Error bars indicate the standard error of the means.

Error bars indicate the standard error of the means.