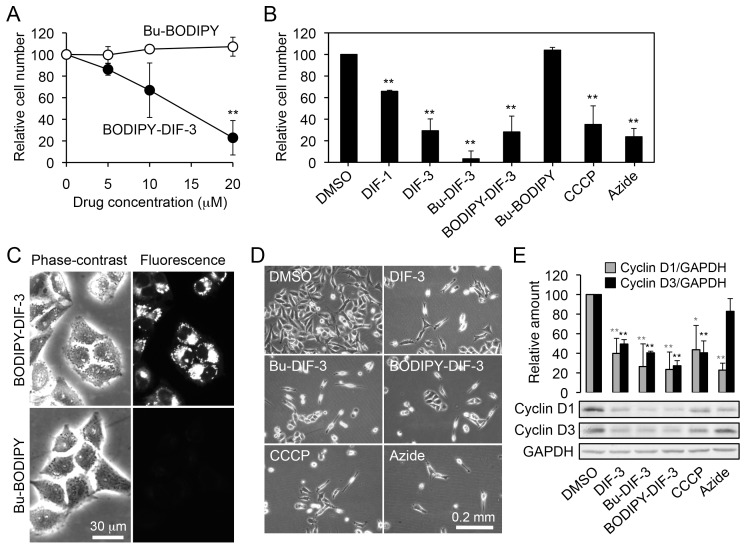
Figure 3. Effects of DIF-like molecules and mitochondrial poisons on cell growth and morphology in HeLa cells.
(A) Cells were incubated for 3 days with 0.2% DMSO (vehicle; open circles), 5–20 µM of Bu-BODIPY (open circles), or BODIPY-DIF-3 (closed circles) and relative cell number was assessed by the use of Alamar blue (a cell-number indicator). The mean values and SD (bars) of four independent experiments are presented. **, P<0.01 versus DMSO control (Concentration, 0). (B) Cells were incubated for 3 days with 0.2% DMSO, 20 µM of DIF-like molecules, 20 µM of BODIPY-coupled compounds, 10 µM CCCP, or 0.01% NaN3 (Azide), and relative cell number was assessed by the use of Alamar blue. The mean values and SD (bars) of five independent experiments are presented. **, P<0.01 versus DMSO control. (C) Cells were incubated for 3 days with 20 µM of Bu-BODIPY or BODIPY-DIF-3, washed free of them, and observed microscopically. Note that BODIPY-DIF-3 stained some organelles, which appeared to be disturbed as compared to those at Day 0 (Figure 1C). (D) Cells were incubated for 3 days with 0.2% DMSO, 20 µM DIF-3, 5 µM Bu-DIF-3, 20 µM BDOIPY-DIF-3, or 10 µM CCCP, and observed by using a phase-contrast microscope. (E) Cells were incubated for 20 h with 0.2% DMSO, 20 µM DIF-3, 5–7.5 µM Bu-DIF-3, 20 µM BDOIPY-DIF-3, or 10 µM CCCP, and the indicated cell proteins were analyzed by Western blotting. Relative amounts of cyclin D1and D3 were normalized with GAPDH (glyceraldehyde-3-phosphate dehydrogenase), and the mean values and SD (bars) of three independent experiments are shown together with representative images of the blots. Note that cyclin D2 was not well detected in our system. *, P<0.05; **, P<0.01 versus DMSO control.

