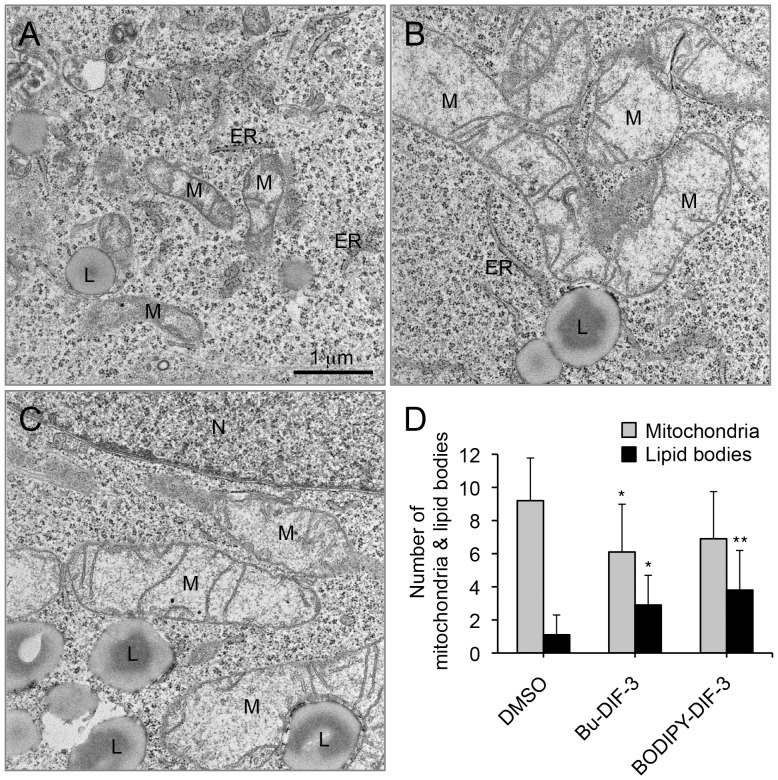
Figure 7. Electron microscopic analysis of HeLa cells treated with Bu-DIF-3 or BODIPY-DIF-3.
(A–C) Cells were incubated for 3 days with DMSO (0.2%; A), Bu-DIF-3 (5 µM; B), or BODIPY-DIF-3 (20 µM; C). Cells were then treated as described in the Methods section and observed by using an electron microscope. Two representative images of three samples are shown. M, mitochondria. L, lipid body. N, nucleus. ER, endoplasmic reticulum. (D) The number of mitochondria and lipid bodies were counted in electron microscopic images that contained only the cytoplasmic region. Data are the mean values (the number of mitochondria or lipid bodies per image) and SD (bars) of ten separate images (n = 10). *, P<0.05; **, P<0.01 versus DMSO control.

