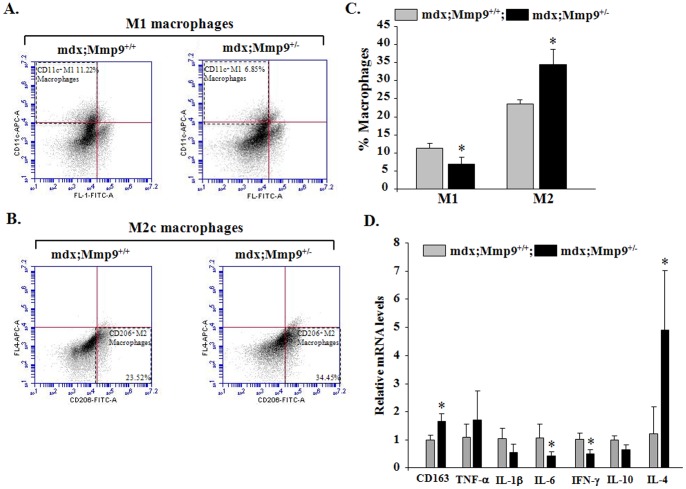
Figure 3. Inhibition of MMP-9 promotes M2 macrophage phenotype in skeletal muscle of mdx mice.
GA muscle of 8-week old mdx;Mmp9+/+ and mdx;Mmp9+/− mice were isolated and processed for FACS analysis for M1 and M2 macrophages in the F4/80+ population after gating out CD45 and Sca1 cells. (A) FACS dot plots displaying the percentage of CD11c+ M1-macrophages (upper left quadrant). (B) Representative dot plots for the percentage of CD206+ M2 macrophages (lower right quadrant). (C) Quantification of relative proportion of M1 and M2 macrophages by FACS technique in GA muscle of mdx;Mmp9+/+ and mdx;Mmp9+/− mice. (D) Fold change in relative mRNA levels of CD163, TNF-α, IL-1β, IL-6, IFN-γ, Il-10, and IL-4 measured by QRT-PCR assay in GA muscle of 8-week old mdx;Mmp9+/+ and mdx;Mmp9+/− mice. N = 3 or 4 in each group. Error bars represent SD. *p<0.05, values significantly different from mdx;Mmp9+/+ mice.

