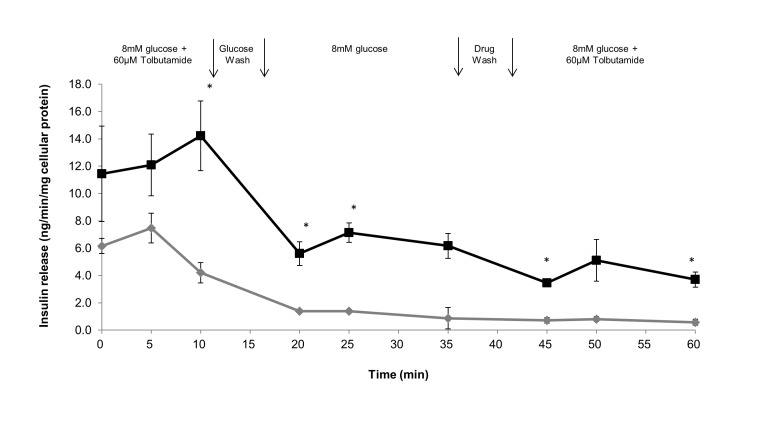
Figure 5. Reactivation of tolbutamide stimulation of insulin release detected from different islet models.
Reactivation of tolbutamide stimulation of insulin release from islets cultured in Islet TF (black line) and standard 2D suspension (grey line) in the presence of 8 mM glucose was studied. After an initial equilibrium period of 15 min (min -15 to 0) in medium containing 8 mM glucose, tolbutamide (60 µM) was added to the medium in the present of 8 mM glucose at min 0, and was withdrawn at min 10, washed with medium containing 8 mM glucose and re-equilibrium for 20 min and reintroduced tolbutamide (60 µM) in the present of 8 mM glucose at min 35 and last 25 min. Values are means ± SEM of 3 independent experiments, each performed in duplicate. Statistical significance of difference between Islet TF and standard 2D models was calculated by Student’s T-test, * p<0.05.

