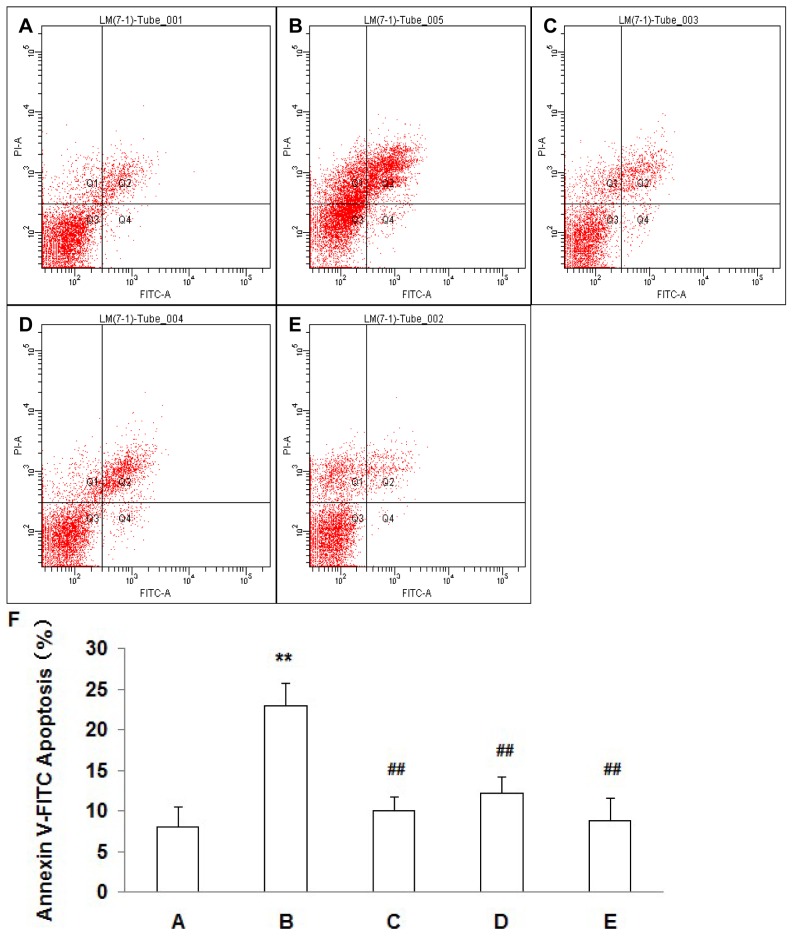
Figure 8. Detection of apoptotic cells with Annexin V assay.
A: normal osmotic pressure group; B: 90 mM NaCl HOP group; C: 90 mM NaCl HOP added with NAC group; D: 90 mM NaCl HOP added with DPI group; E: 90 mM NaCl HOP added with SP600125 group. Statistics (F) showed that the percentage of apoptotic cells in the 90 mM NaCl HOP group was significantly higher than that in the normal osmotic pressure group (P<0.01), and the percentage of apoptotic cells in the HOP group added with NAC, DPI and SP600125 significantly decreased (P<0.01). (mean±SD, n = 3). ** P<0.01 vs. A, ## P<0.01 vs. B.

