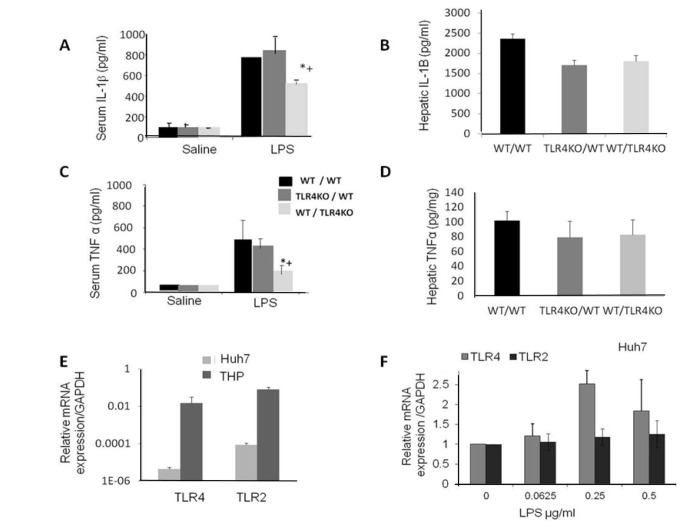
Figure 5. A,C: TNFα and IL-1β protein expression in chimeras in serum and liver.
In all chimeras, both TNFα and IL-1β increased significantly at 4 hours post LPS challenge. The proinflammatory cytokine levels in chimeras expressing TLR4 in the liver were found to be significantly higher than the levels expressed in TLR4KO chimera livers ( * p<0.05 vs. WT/WT LPS treated ; + p<0.01 vs. + WT/WT saline-treated). Values are mean±SEM ( n=6 mice per group). B,D: Hepatic TNFα and IL-1β expression: No differences were observed between hepatic TNFα and IL-1β whether the livers expressed TLR4 or KO for TLR4. Values are mean±SEM (n=3 mice per group). E: TLR2 and TLR4 mRNA expression level in a Huh7 cell line: Macrophages expressed a significantly higher level of TLR4 and TLR2 mRNA compared with the hepatocyte cell line (p < 0.0001). F: TLR2 and TLR4 mRNA expression following LPS treatment: LPS induced TLR4 activation in a hepatocyte cell line in a dose dependent manner while there was no change in TLR2 mRNA expression. The results are shown as the fold-change of the relative quantity of TLR mRNA normalized to GAPDH mRNA values; the control cells were assigned a value of 1 and results are normalized to controls. Each point represents the mean ±SEM of a set of data determined by at least 5 experiments.

