
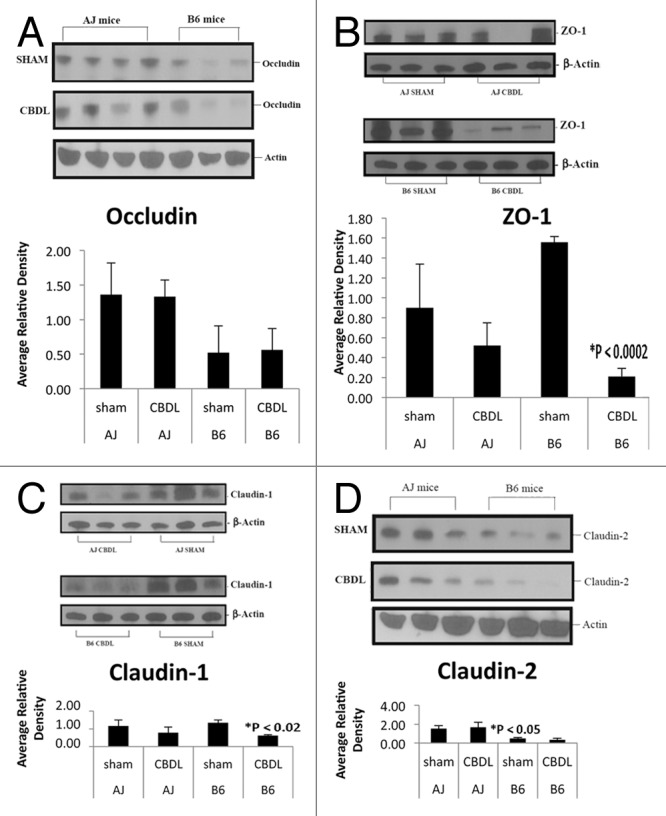
Figure 4. Tight junction protein expression by western blot analysis. Note each lane represents tissue from a separate mouse. (A) Occludin protein expression appeared decreased in B6 mice compared with A/J mice; however, densitometry showed only a trend when comparing shams (p = 0.10). (B) Following CBDL, ZO-1 protein expression was significantly decreased in B6 mice (*p < 0.0002) but not A/J mice. (C) Claudin-1 protein expression decreased significantly (*p < 0.02) in B6 but not A/J mice following CBDL. (D) Interestingly, claudin-2 protein expression was significantly decreased in B6 sham mice compared with A/J sham mice (*p < 0.05). There was a trend toward decreased claudin-2 expression in B6 CBDL mice compared with A/J CBDL mice (p = 0.09).