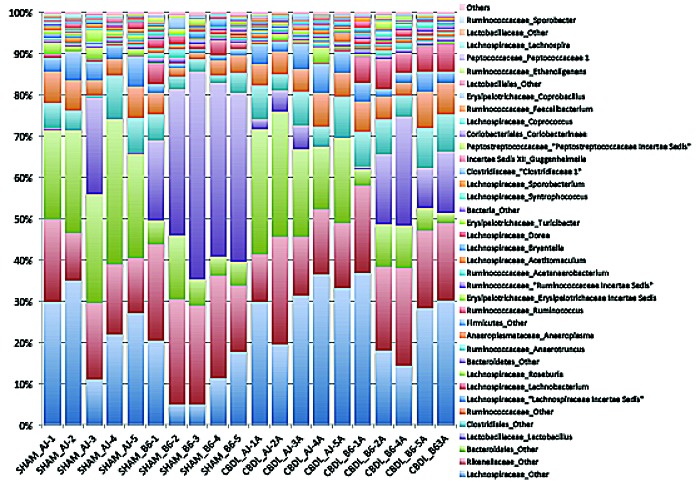
Figure 9. Bar Graph of genera for fecal microbiota collected from sham and ligated A/J and B6 mice (n = 5 mice for each of four groups). Note the decrease in Lactobacillus (first purple bar from the bottom) and increase in Clostridiales (blue bar directly above first purple bar from the bottom) in ligated B6 mice as compared with sham B6 mice. This signifies a transition from a more benign to a more virulent microbiota.

An official website of the United States government
Here's how you know
Official websites use .gov
A
.gov website belongs to an official
government organization in the United States.
Secure .gov websites use HTTPS
A lock (
) or https:// means you've safely
connected to the .gov website. Share sensitive
information only on official, secure websites.
