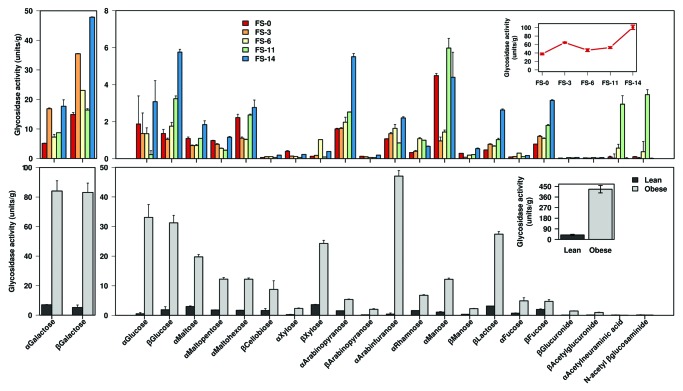
Figure 1. Shifts in carbohydrate turnover profile. Enzyme activities (units/g total protein) from the total faecal microbiota against 23 different sugar substrates were quantified by measuring the release of pNP in triplicates, as described in Materials and Methods section. (A) Glycosidase profile for both β-lactam-treated adult patients P1 and P2 in the time span investigated. (B) Glycosidase profile for lean (n = 5) and obese (n = 7) adolescents. A single plot (with mean values ± SD, estimated for each group of samples using three independent measurements each) is shown for P1/P2 (panel A) and lean and obese subjects (panel B), as no statistically significant differences in activity values were discernible within each set of samples. The insets in panels (A) and (B) represent the cumulative activity (total units/g ± SD) for all sugars being hydrolyzed for each of the samples. Note: α- and β-galactosidase activities were separated, as the activity levels were significantly higher as compared with the other activities and are shown in the left panels..

An official website of the United States government
Here's how you know
Official websites use .gov
A
.gov website belongs to an official
government organization in the United States.
Secure .gov websites use HTTPS
A lock (
) or https:// means you've safely
connected to the .gov website. Share sensitive
information only on official, secure websites.
