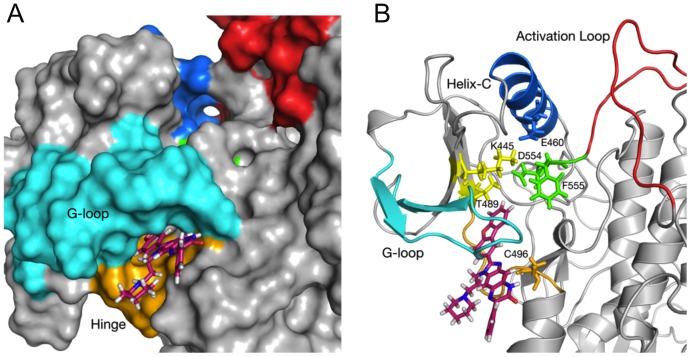
Figure 3. Molecular Modeling of CTA095-Etk binding.
(A) Surface view of Etk docked to CTA095 after 20 ns of MD minimization and relaxation. R3 and the three-ring core docked deeper between Glycine-rich loop region (cyan) and hinge region (orange), R1 and R2 are solvent exposed. Blue: Helix C; Red: Activation Loop; Green: DFG motif (554–556); Cyan: Glycine-rich loop; Orange; Hinge Region. (B) Cartoon representation showing predicted interactions of CTA095 with the gatekeeper Thr489, DFG (554–556) motif, and Cys496. CTA095 binding stabilizes Phe555 in ‘out’ configuration, and affects the active state salt bridge formation between Lys445 and Glu460. Blue: Helix C; Red: Activation Loop; Green: DFG motif (554–556); Cyan: Glycine-rich loop; Orange; Hinge Region. Figures were generated using PyMol.

