
Figure 3. Relation between clearance of plasma 13C-methacetin (represented by the parameter M0.5 indicating the time required for a 50% drop) and the DOB curve parameter DOBmax (triangles), DOBmaxT (circles) and DOB20 (squares).
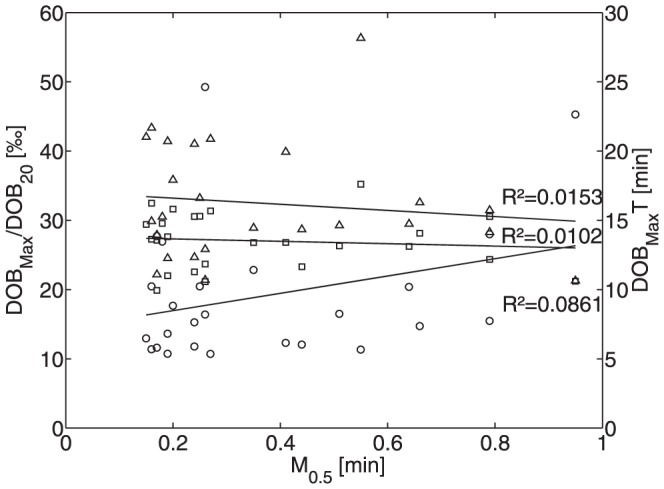
Numerical values of these parameters for the 25 subjects are given in Table 1. DOBmax and DOB20 are given in ‰.