
Figure 5. DOBB curves initiated by the direct injection of 1 mmol/l 13C-bicarbonate into the plasma at time t = 0.
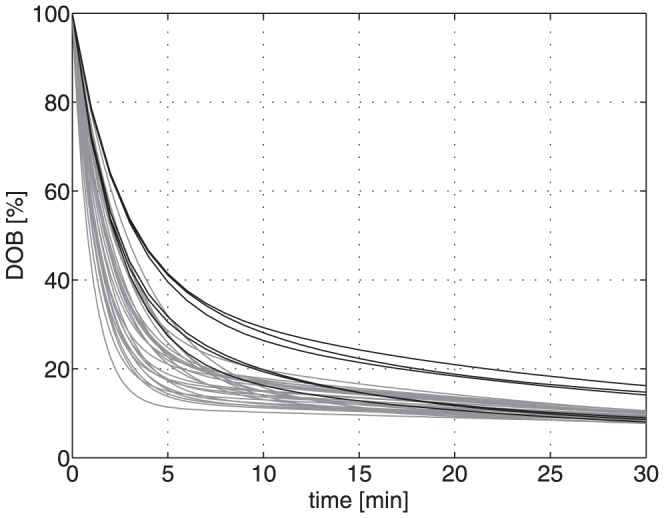
Thin lines represent simulated DOB curves based on the kinetic model parameters k+C and k−C determined for the 25 subjects (see Table 1). Bold lines indicate DOB curves fitted to experimental data measured in 6 patients [20]. The DOB values are normalized to the DOB value at t = 0 (100%).