
Figure 6. Relationship between FMHC and the severity of liver function impairment assessed by the LIMAX score FHMC values were estimated for 30 patients with different severity of liver function failure by fitting the model equation system (2) to conventional DOB curve data while fixing the values of the kinetic parameters k+C, k−C for systemic CO2/bicarbonate kinetics at the mean value obtained in the 25 investigated subjects.
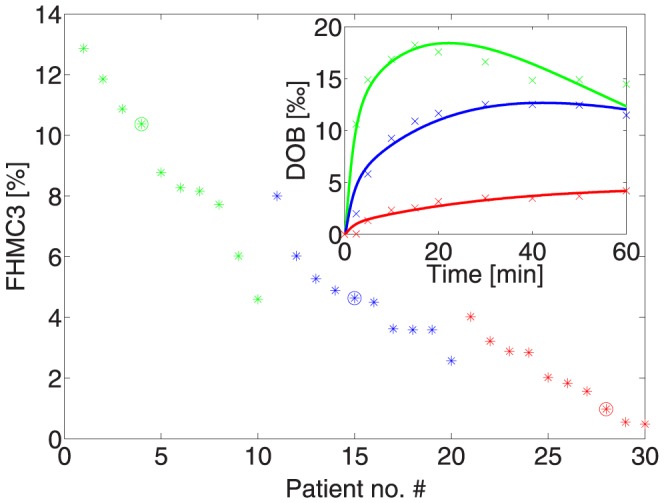
Based on the LIMAX score the patients were arranged into three different groups of liver function failure (indicated by the colors green, blue and red) and within each group ranked with their FMHC value. The inset shows experimental and fitted DOB curves for three patients belonging to different classes of liver function impairment (indicated by a circle in the FHMC versus patient no. plot).