
Figure 7. Simulated DOB (values in ‰) curves of a ‘generic’ patient at different degrees of liver impairment.
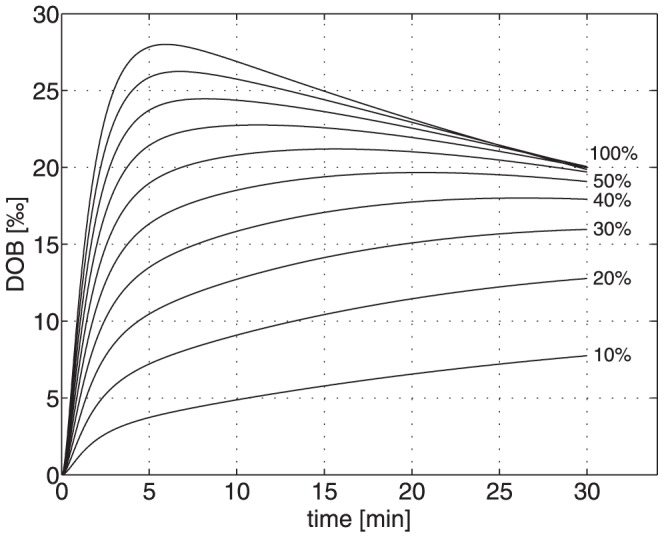
The value of the metabolization rate was successively reduced in steps of 10% from the initial 100%-value (kL = 0.09 min−1).
Official websites use .gov
A
.gov website belongs to an official
government organization in the United States.
Secure .gov websites use HTTPS
A lock (
) or https:// means you've safely
connected to the .gov website. Share sensitive
information only on official, secure websites.
The value of the metabolization rate was successively reduced in steps of 10% from the initial 100%-value (kL = 0.09 min−1).