
Figure 8.
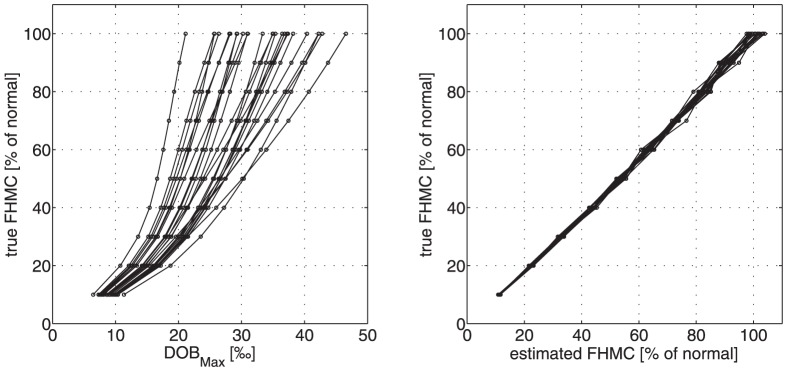
A Conventional breath test: Relation between the true value of the liver function parameter FHMC and the characteristic parameter DOBmax of DOB curves. DOB curves were simulated at various degrees of liver impairment by reducing the value of the model parameter kL in steps of 10%. For each degree of liver function impairment, we used the 25 different parameters pairs k+C, k−C for systemic CO2/bicarbonate kinetics obtained in the 25 investigated subjects. Note that for the liver-healthy ‘generic’ patient ( = 100% metabolization capacity) the variance of DOBmax is 8.1 thus being 25% of the mean (36.7). B 2DOB breath test: Relation between true and estimated values of the liver function parameter FHMC. Estimation of FHMC values was performed by fitting the compartment model to the 2-phasic DOB curve resulting from injection of 13C- bicarbonate followed by injection of 13C-methacetin (see Fig. 6).