
Figure 9. Simulated DOB (values in ‰) curves for the conventional breath test and the proposed novel 2DOB method.
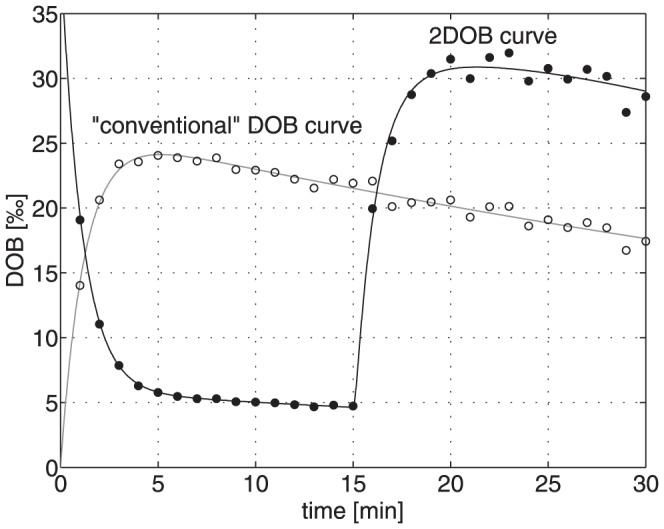
The conventional breath tests was simulated by generating DOB curves with the mean values of the kinetic model parameters determined in the 25 subjects (see Table 1). We imposed a random error of 15% to the simulated DOB data (open circles) and approximated these data by the exponential regression function (thin line) from which the characteristic parameters of the DOB were derived. Simulation of 2DOB breath test was done in a similar way but with the exception that first at time t = 0 a bolus of 0.1 mmol/l 13C-bicarbonate followed by the injection of 2 mg 13C-methacetin/kg bodyweight at time t = 15 min. A random error of 15% was imposed to the simulated 2-phasic DOB data (closed circles). Fitting of equation system (2) to these data yielded the model parameters k+C, k−C, k+M, k−M and kL and theoretical time-courses of DOB (bold line) and of 13C-methacetin (curve not shown) in the liver. Based on this information the numerical value of FHMC was estimated.