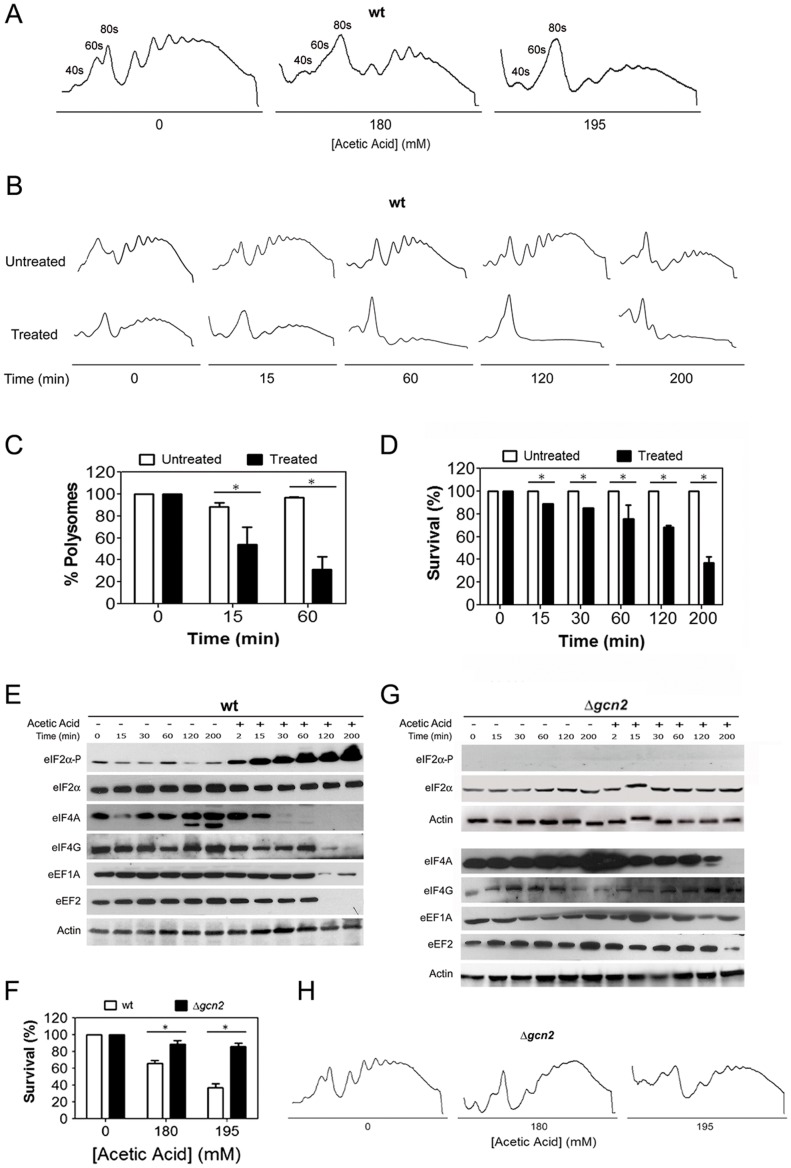
Figure 1. Impairment of global translation during acetic acid treatment is mediated by translation machinery alterations.
(A) Polysome profile of wild-type yeast cells treated with the indicated concentrations of acetic acid for 15 min. The peaks containing the small (40S) and large ribosomal subunit (60S), or free ribosomes (80S) are indicated. (B) Time-course analysis of the polysome profiles of wild-type cells untreated or treated with 195 mM of acetic acid for 15, 60, 120 or 200 min. (C) Analysis of the percentage of total mRNA present in the polysome fractions of polysome profiles of wild-type cells at 0, 15 or 60 min of 195 mM of acetic acid treatment (white bars correspond to control untreated cells and black bars to acetic acid treated cells; *p<0.05 versus wild-type untreated cells, t-test, n = 3). (D) Kinetic analysis of wild-type cells survival for 200 min of acetic acid treatment (195 mM) (white bars correspond to control untreated cells and black bars to acetic acid treated cells; *p<0.05 versus wild-type untreated cells, t-test, n = 3). Immunoblot kinetic analysis of eIF2α (Sui2p) phosphorylation levels, and expression levels of translation factors eIF2α (Sui2p), eIF4A (Tif1/2p), eIF4G (Tif4631/2p), eEF1A (Tef1/2p) and eEF2 (Eft1/2p) in (E) wild-type (wt) and (G) GCN2 deleted Saccharomyces cerevisiae cells untreated or treated with 195 mM of acetic acid. Actin was used as loading control. (F) Comparison of the survival rate of wild-type and GCN2 deleted S. cerevisiae cells upon treatment with the indicated concentrations of acetic acid (white bars correspond to wild-type cells and black bars to GCN2 deleted cells; *p<0.05 versus wild-type cells, t-test, n = 3). (H) Polysome profile of GCN2-disrupted yeast cells treated with the indicated concentrations of acetic acid for 15 min.

