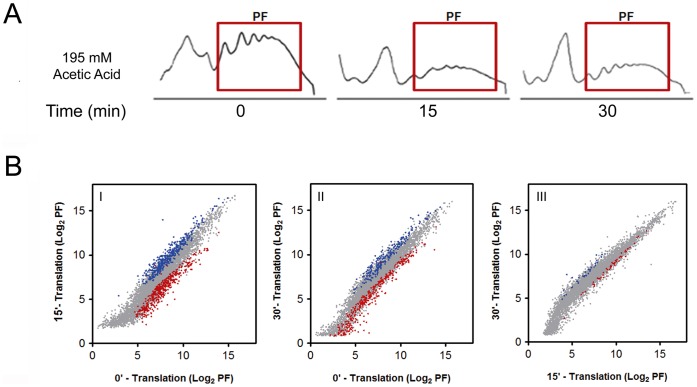
Figure 2. Microarray analysis of mRNAs translated during acetic acid treatment.
(A) Polysome fractions (PF) from the polysome profiles of wild-type cells at 0, 15 or 30 min of acetic acid (195 mM) treatment collected for microarray and qPCR analysis. (B) Graphical representations of the translational microarray data normalized by the levels of hybridized mRNAs from the same amount of total polysome mRNAs altered from 0 to 15 min (I), 0 to 30 min (II) and 15 to 30 min (III) of acetic acid treatment normalized by the amount of mRNA in polysome fractions at each time point. The mRNAs in polysome fractions at 15 min or 30 min of acetic acid treatment (log2 PF) have been plotted against the mRNAs in polysome fractions at 0 min of acetic acid treatment (control). Translationally regulated mRNAs (having increased association with polysomes in blue and decreased association with polysomes in red) at 15 min or 30 min of acetic acid treatment have been highlighted in the cross-dot plots.

