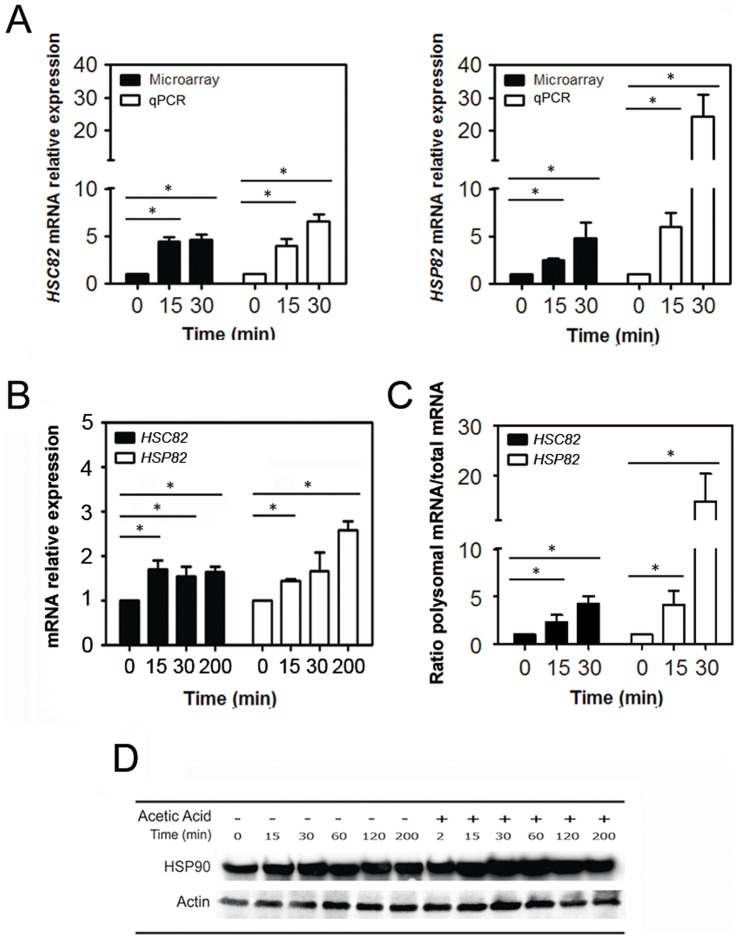
Figure 4. HSP90 isoforms are selectively translated during acetic acid treatment.
(A) Comparison of microarray data with qPCR analysis of HSC82 and HSP82 mRNA expression in polysome fractions upon 15 or 30 min of acetic acid treatment (black bars correspond to microarray and white bars to qPCR results; *p<0.05 versus time 0 min, t-test, n = 3). (B) qPCR analysis of HSC82 and HSP82 expression in total mRNA of yeast cells after acetic acid treatment (195 mM) for 0, 15, 30 or 200 min (black bars correspond to HSC82 mRNA and white bars to HSP82 mRNA; *p<0.05 versus time 0 min, t-test, n = 3). (C) Ratio between HSC82 and HSP82 mRNAs associated with polysomes and their presence in total mRNA of yeast cells after acetic acid treatment (195 mM) for 0, 15 or 30 min (black bars correspond to HSC82 mRNA and white bars to HSP82 mRNA). (D) Immunoblot kinetic analysis of HSP90 proteins levels in wild-type Saccharomyces cerevisiae cells after 0, 15, 30, 60, 120 or 200 min of treatment with acetic acid (195 mM).

