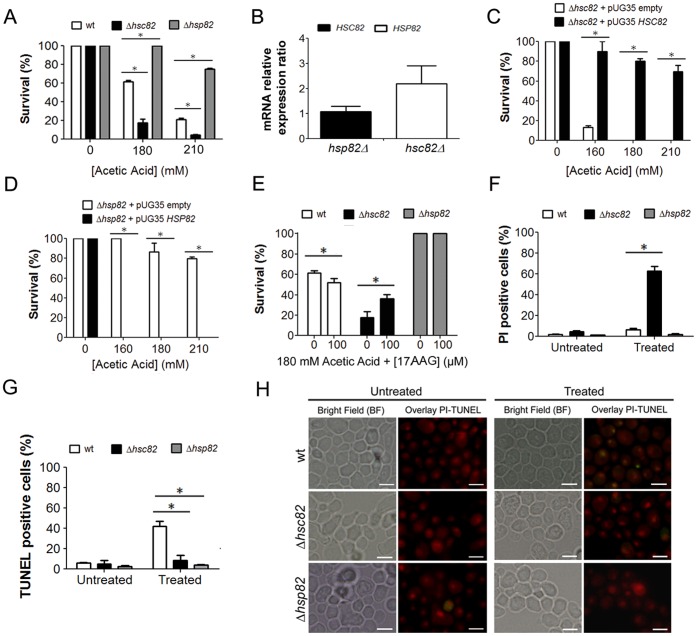
Figure 5. HSP90 isoforms display distinct and antagonistic functions in response to acetic acid treatment.
(A) Comparison of the survival rates of wild-type, Δhsc82 and Δhsp82 Saccharomyces cerevisiae cells after acetic acid treatment (white bars correspond to wild-type cells, black bars to Δhsc82 cells and grey bars to Δhsp82 cells; *p<0.05 versus wild-type cells, two-way ANOVA, n = 3). (B) Ratio of HSC82 and HSP82 mRNA relative basal expression observed in Δhsc82 and Δhsp82 S. cerevisiae cells, respectively, in comparison with wild-type cells. Analysis of the survival rates of (C) Δhsc82 and (D) Δhsp82 S. cerevisiae cells harboring a pUG35 plasmid expressing HSC82 or HSP82, after treatment with 0, 160, 180 or 210 mM acetic acid (white bars correspond to cells harboring the empty plasmid and black bars to cells expressing the HSC82 or HSP82 gene; *p<0.05 versus cells harboring the empty plasmid, t-test, n = 3). (E) Comparison of the survival rates of wild-type, Δhsc82 and Δhsp82 S. cerevisiae cells treated with 180 mM of acetic acid in the presence of 100 µM 17-allylaminogeldanamycin (17AAG), an inhibitor of HSP90 (white bars correspond to wild-type cells, black bars to Δhsc82 cells and grey bars to Δhsp82 cells; *p<0.05 versus absence of 17AAG, two-way ANOVA, n = 3). (F) Flow cytometry analysis of propidium iodide (PI) staining of wild-type, Δhsc82 and Δhsp82 S. cerevisiae cells after acetic acid treatment (180 mM) (white bars correspond to wild-type cells, black bars to Δhsc82 cells and grey bars to Δhsp82 cells; *p<0.05 versus wild-type cells, two-way ANOVA, n = 3). (G) Percentage of wild-type, Δhsc82 and Δhsp82 cells displaying TUNEL positive phenotype (white bars correspond to wild-type cells, black bars to Δhsc82 cells and grey bars to Δhsp82 cells; *p<0.05 versus wild-type cells, two-way ANOVA, n = 3). (H) Epifluorescence and bright field micrographs of untreated and acetic acid treated (180 mM) wild-type, Δhsc82 and Δhsp82 cells displaying TUNEL reaction to visualize double-strand DNA breaks. Cells were co-stained with propidium iodide in order to facilitate nuclei visualization. TUNEL-positive cells correspond to cells with yellow nuclei due to the overlay between TUNEL reaction, green, and PI staining, red. Bar, 5 µm.

