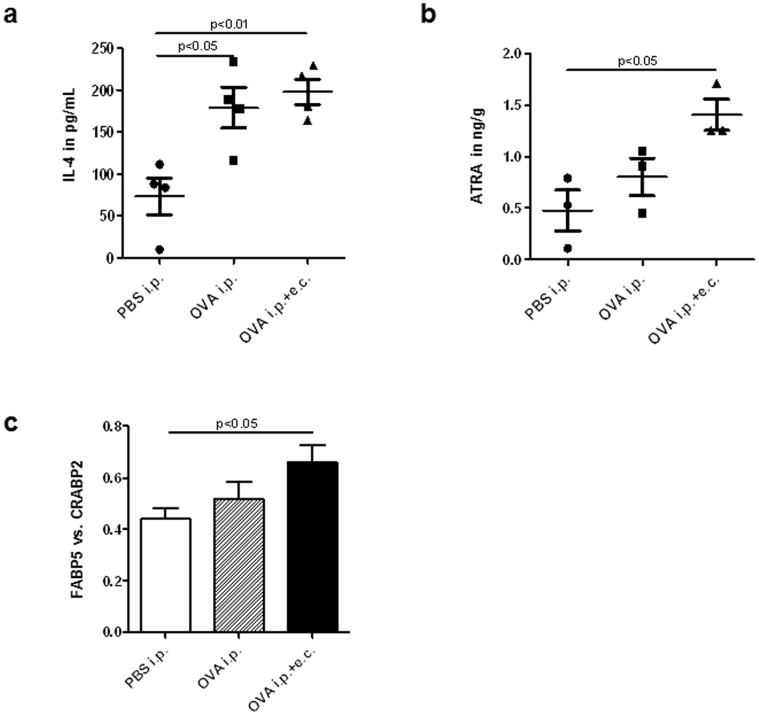
Figure 2. Serum levels of IL-4 and ATRA and the Fabp5 vs. Crabp2 ratio are increased in skin after OVA sensitizations.
(a) IL-4 serum levels after systemic with or without additional topical OVA sensitization (n = 8). (b) ATRA levels in mouse skin determined by HPLC MS-MS method upon systemic (i.p.) and systemic plus topical (i.p.+e.c.) OVA sensitization (n = 3/group). (c) Ratio of Fabp5 vs. Crabp2 expression in the skin of OVA-treated mice (n = 6/group) compared to control mice (PBS i.p.). Data are presented as mean values ± SEM. Statistical significance (p) is based on one-way ANOVA followed by Tukey’s multiple comparison test for gene expression results and ELISA data. For HPLC MS-MS results, significance was determined using Student’s t-test.

