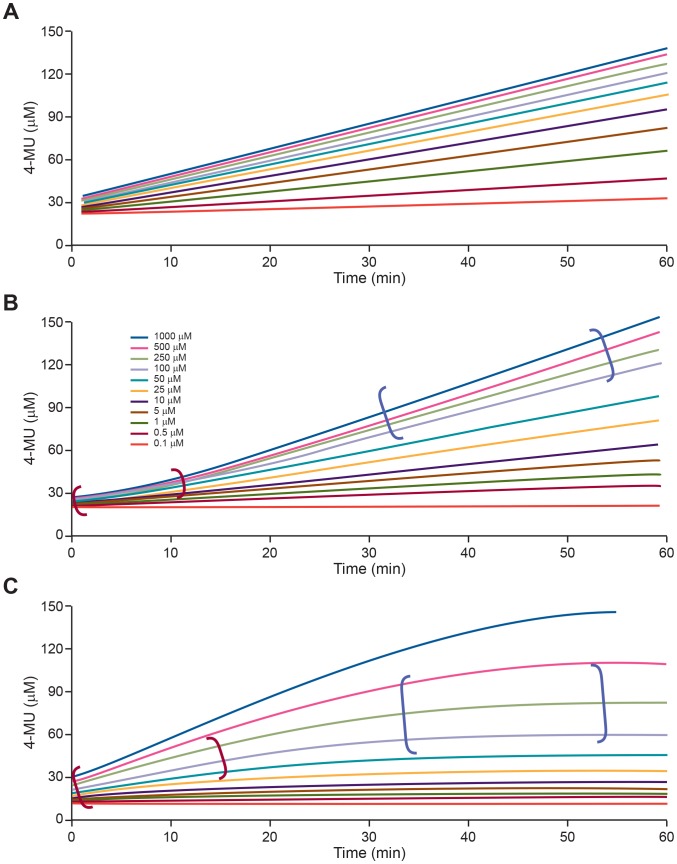
Figure 3. Possible kinetic profiles of NA enzyme reactions at different MUNANA substrate concentrations.
Fluorescence intensity was recorded every 60 s for 60 min at 37°C with the MUNANA substrate at the final concentration of 0.1–1000 µM. (A) Profile consistent with steady-state conditions during the time of the reaction. (B) Dataset with initial lag phase (shown in red parentheses) and (C) datasets with lag (shown in red parentheses) and saturated phases (shown in blue parentheses) indicate suboptimal assay conditions and a requirement for assay optimization.

