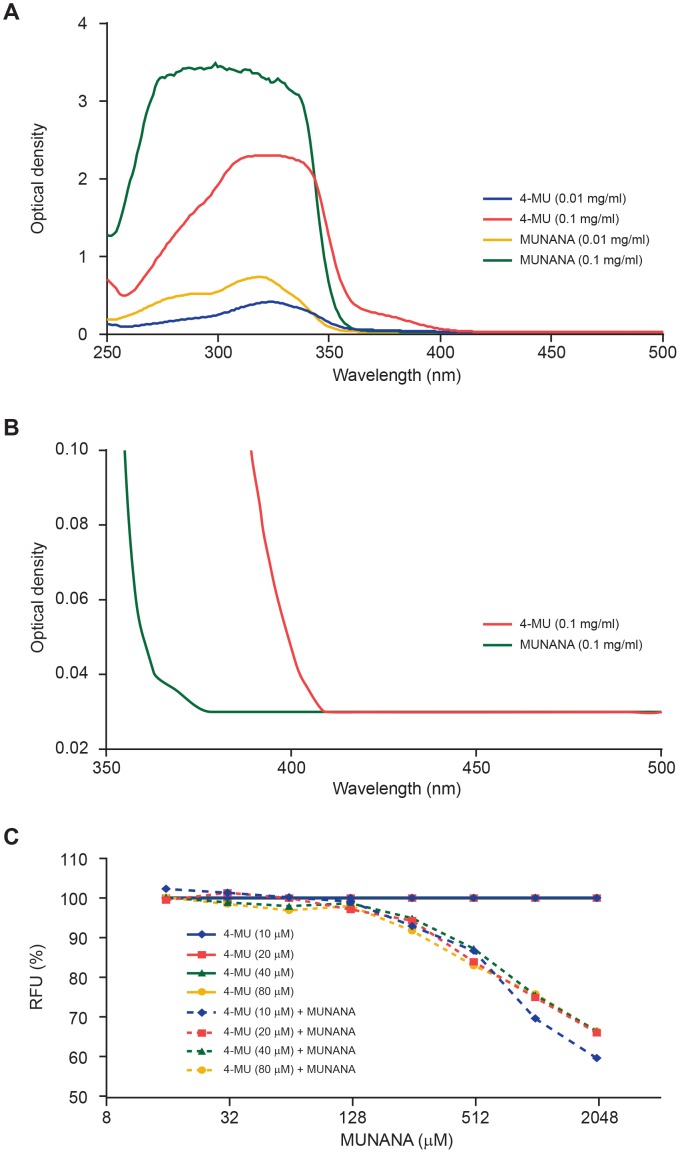
Figure 4. Inner filter effect (IFE) from light absorption at the excitation and emission wavelengths of the 4-MU product.
(A) Absorbance spectra of MUNANA and 4-MU at 0.01 mg/mL and 0.1 mg/mL concentrations in enzyme buffer. Optical density was measured using Synergy 2 multi-mode microplate reader in a UV-transparent 96-well plate. (B) Absorbance spectra of MUNANA and 4-MU at 0.1 mg/mL concentration. (C) 4-MU fluorescence measured in the presence of different concentrations of MUNANA (15–2000 µM) shows similar impact of MUNANA-associated spectroscopic interference across 4-MU concentrations of 10–80 µM.

