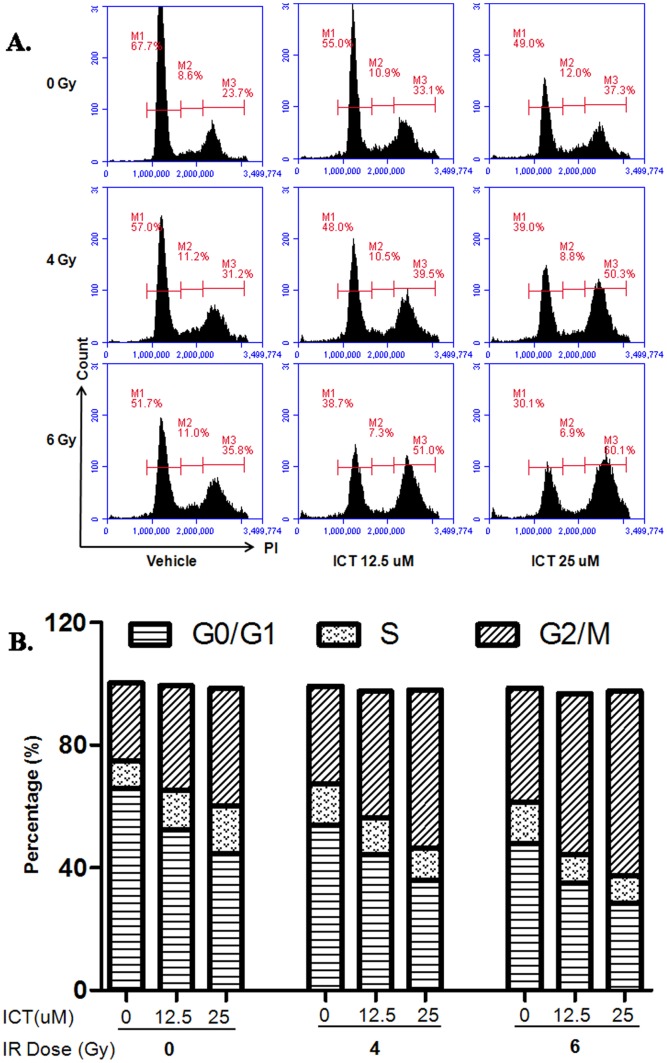
Figure 4. Accumulation of G2-M cell population after combination of ICT and IR.
4T1 cells were treated with ICT (0, 12.5, 25 µM), IR (0, 4, or 6 Gy), or ICT combined with IR. 72 hours after treatment, the cells were harvested and subjected to flow cytometry. (A) FCM images represent the fraction of cells in G0G1 phase (M1), S phase (M2) and G2-M phase (M3) after different single or combined treatment. (B) Bar graphs represent the percentage of cells in three different phases.

