
Figure 2. Venn diagram of total proteins identified in the supernatant of RBCs (A) and LR-RBCs (B) stored days 1 and 42.
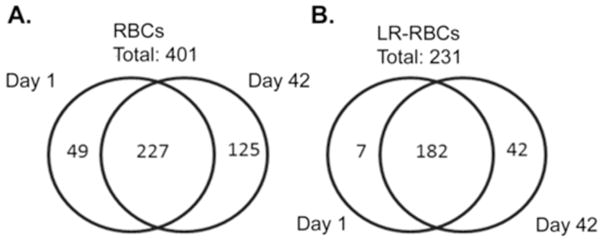
These diagrams represent a breakdown of the total proteins identified. The numbers on the left (D1) and right (D42) are the number of protein unique to the RBC or LR-RBC supernatant. The numbers in the center are the total number of proteins that are in both D1 and D42 supernatant samples.