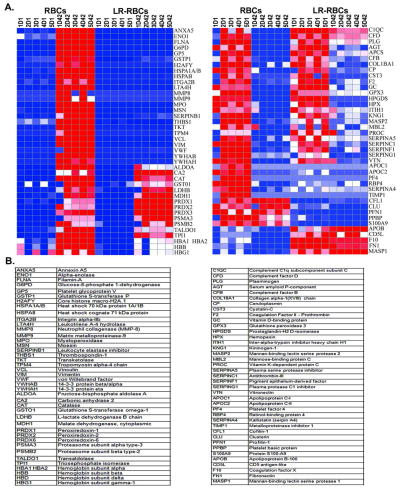
Figure 3. Heat map of select identified proteins across RBC and LR-RBC supernatants.
A. Proteins are grouped by patterns of relative abundance change for both RBC and LR-RBC supernatants at day (D1) and D42 of 5 stored units. Gene names are on the right of the heat maps with the protein identification below (B). The map reads from the very little (blue) to a 1:1 ratio (white) to the greatest amount (red).

